


FIG. 2.
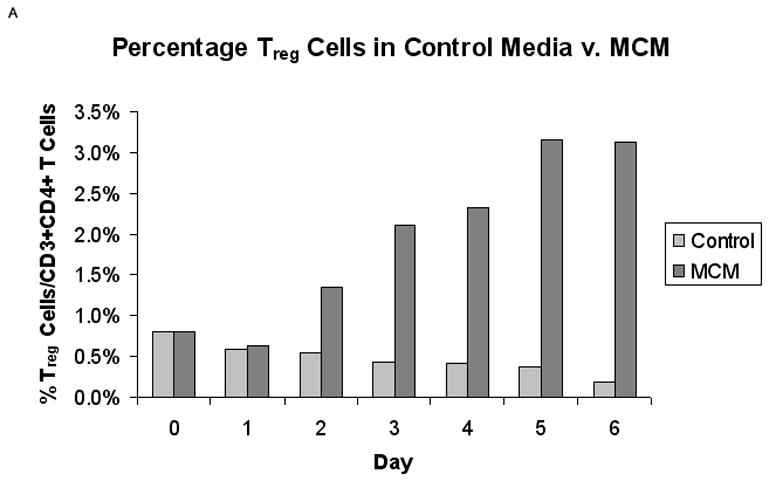
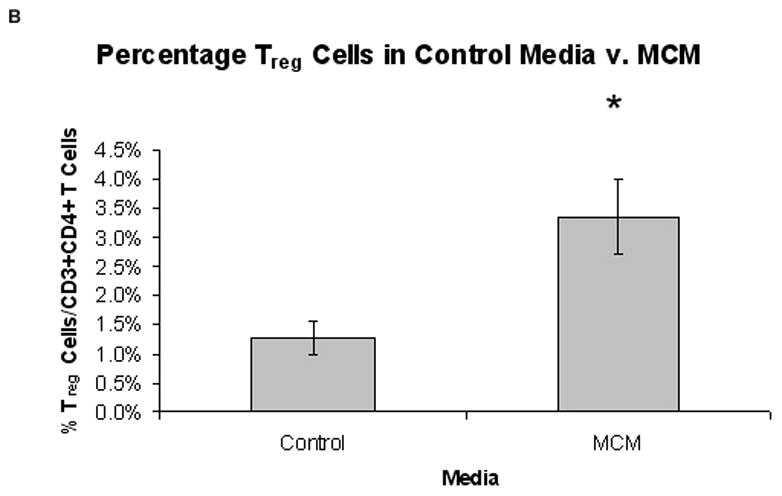
Proportion of Treg cells from normal PBMCs in MCM versus control media (n = 5). (A) Representative graph of the percentage of CD25+/FOXP3+ Treg cells in control media versus MCM over time. (B) There was a significantly higher percentage of Treg cells in MCM versus control after six days (3.4% v. 1.3%, respectively, *P < 0.02). Graph represents mean values ± SEM of the percentage of CD25+FOXP3+ Treg cells in CD3+CD4+ T cells from PBMCs grown in control media versus MCM after six days.