


Fig. 2.
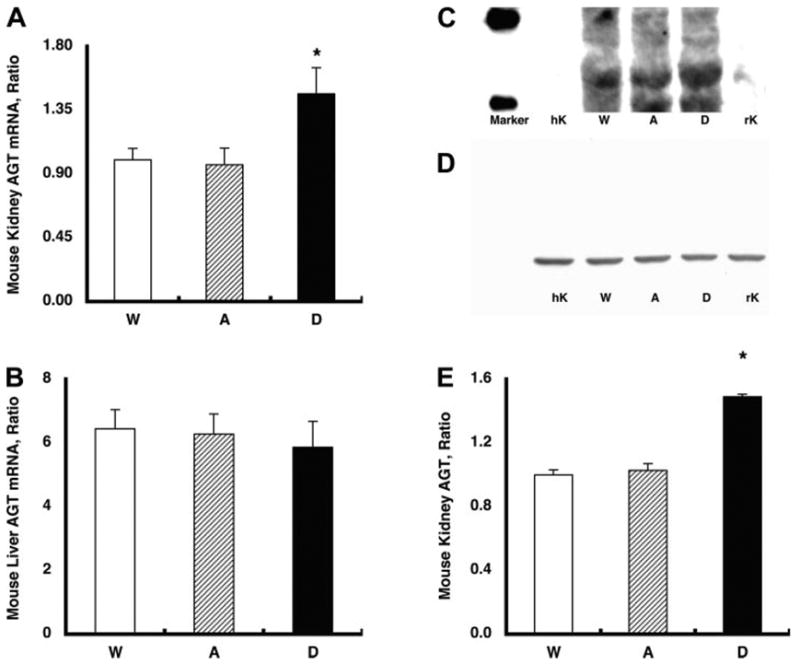
A: endogenous mouse (m) AGT mRNA levels in the kidney. Endogenous mAGT mRNA levels in the kidney were increased significantly in group D mice (1.46 ± 0.19, relative ratio) compared with group A (0.97 ± 0.12) and group W (1.00 ± 0.08) mice. *P < 0.05 compared with the group W mice. B: endogenous mAGT mRNA levels in the liver. The augmented endogenous mAGT levels were limited in the kidney because endogenous mAGT mRNA levels in the liver were not altered among the three groups. C: representative Western blot analysis for endogenous mAGT protein. The developed antibody specific for rodent AGT recognized AGT in mouse kidney (10 μg of protein) and rat kidney (10 μg of protein) but not in human kidney (10 μg of protein). With the use of this rodent-specific AGT antibody, kidney protein samples from group A, D, and W mice were evaluated. D: representative Western blot analysis for β-actin protein showing that β-actin protein levels were similar among the groups. E: densitometric analysis demonstrated that endogenous mAGT protein in the kidney was also increased significantly in group D (1.49 ± 0.02, relative ratio) compared with group A (1.03 ± 0.04) and group W (1.00 ± 0.03) mice. *P < 0.05 compared with the group W mice.