


Figure 2.
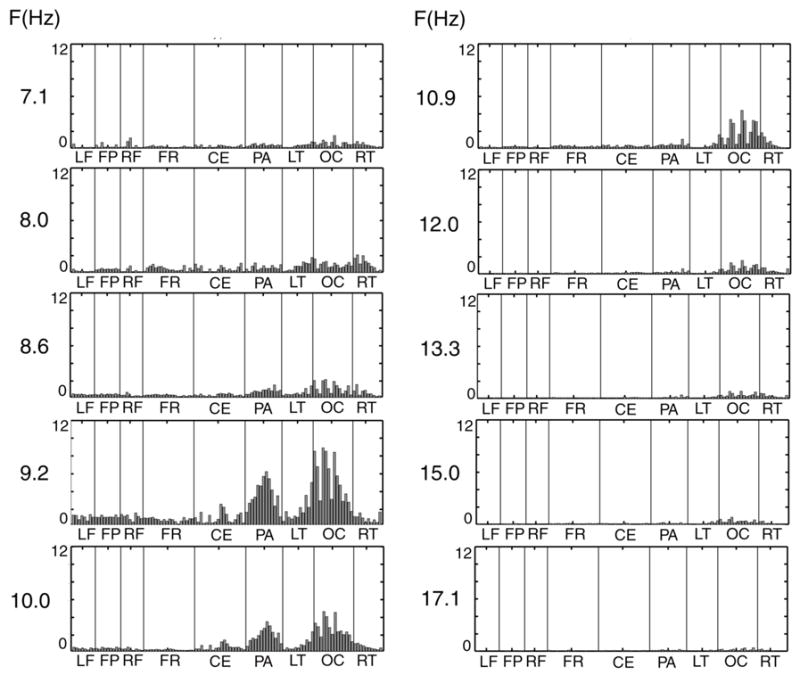
Power at the stimulus frequency at 111 channels. Each bar plot corresponds to a different stimulus frequency and is organized according to channel groups: LF – Left Prefrontal; FP – Frontal Pole; RF- Right Prefrontal; CF- Central Frontal; CE – Central; PA – Parietal; LT – Left Temporal; OC – Occipital; RT – Right Temporal. Power values are given in squared microvolts. Note that the magnitude and spatial distribution of the steady-state response at the stimulus flicker frequency depends strongly on the flicker frequency.