


FIGURE 3. Cortical granules are hemifused to the plasma membrane.
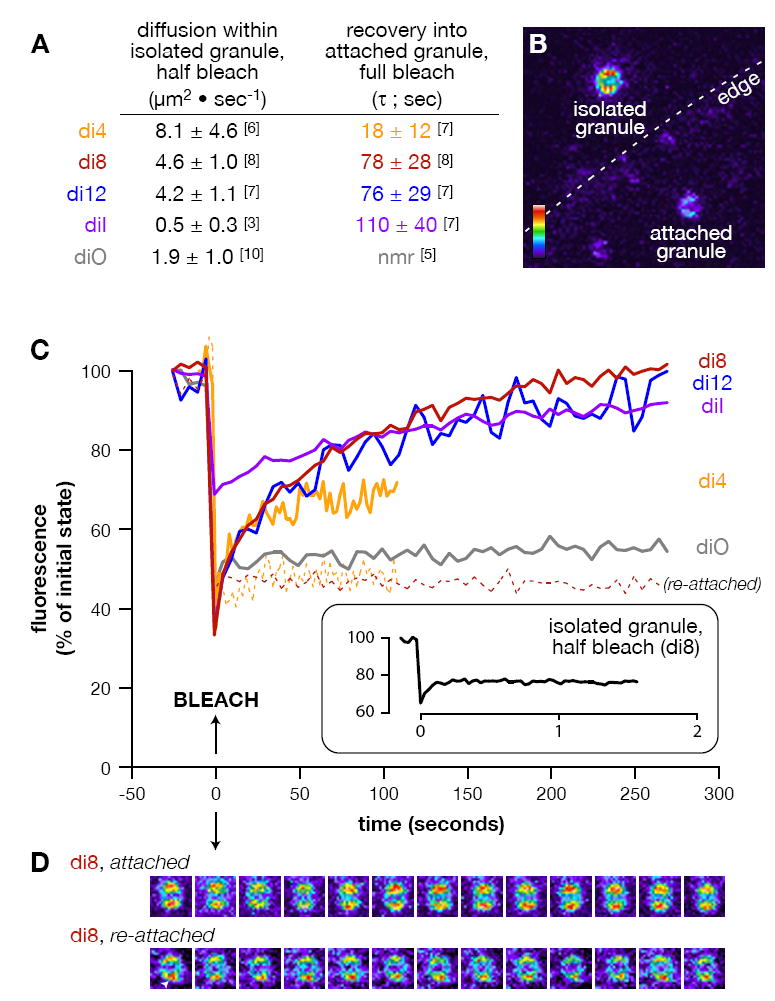
(A) List of specific diffusion rates and recovery times calculated for the 5 lipid probes used (see Methods). Numbers in brackets equal replicates per treatment. “nmr” = no measurable recovery. (B) Representative pseudocolor image of the types of vesicles analyzed. Attached and isolated cortical granules are found in the background image, with the edge of the plasma membrane indicated (dashed line). Colorized scale indicates lowest (black) to highest (white) fluorescence intensity. (C) Mean fluorescence recovery curves are shown for diffusion of lipid probes into fully bleached, attached cortical granules (solid lines) and re-associated cortical granules (dashed lines; di-4-ANEPPS n=3, di-8-ANEPPS n=4). (Inset) Mean recovery of di-8-ANEPPS in isolated, half-bleached granules. The time of bleaching was arbitrarily set as the origin of the time axis. All time-series data per replicate were normalized between the background (0%) and maximum fluorescence (100%) of the first pre-bleach frame. (D) Sequential snapshots from a representative fully bleached, attached and re-attached cortical granule stained with di-8-ANEPPS. Images are pseudocolored (as in ‘A’), with each separated from its predecessor by 25 seconds within the time-series. Arrowhead indicates a protrusion from a re-attached granule indicative of a hemifusion stalk (Zampighi et al., 2006). None of the preparations contained free probe in the media that could account for the recovery (see Methods).