


Figure 6.
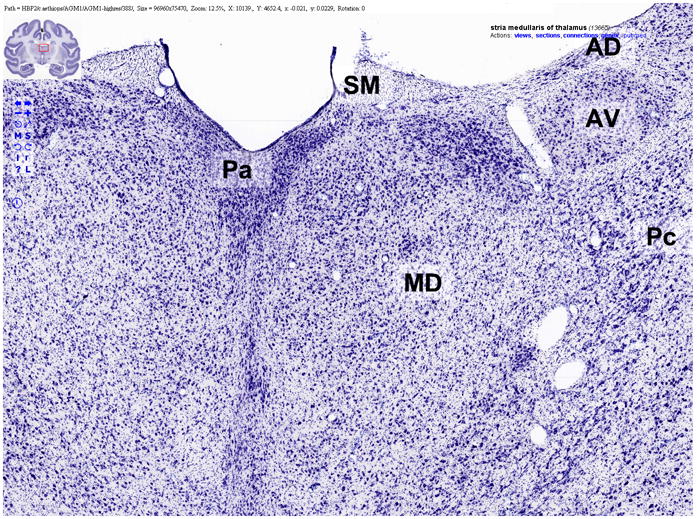
An example of a Flash-based graphical user interface for viewing high-resolution neuroanatomical images at BrainMaps.org. Note the overlaying labels (“Pa”, “MD”, “AD”, “AV”, “Pc”, and “SM”) and the label-specific context menu in the upper right that enables the user to retrieve related information, including the position of the label in the labeling hierarchy, connectivity, and patterns of gene expression.