


Figure 2.
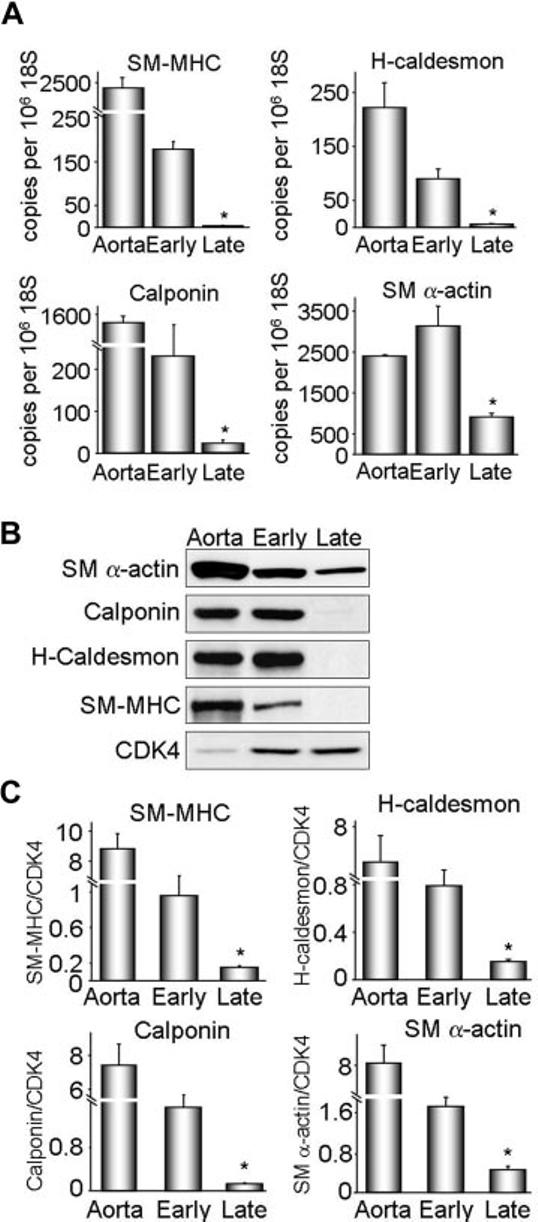
Characterization of VSMC differentiation state in vitro. Protein and RNA were extracted from early (1–2) and late (6–13) passage VSMCs. A, SM-MHC, H-caldesmon, calponin, and SM α-actin cDNA levels were measured by quantitative real-time polymerase chain reaction. Data were normalized to 106 copies 18S cDNA. Whole aorta cDNA was used as a positive control. Results are expressed as mean± SEM (n=4 to 6). *P<0.01 compared with early passage. B, Western blot analysis of differentiation marker protein expression. Cyclin-dependent kinase 4 (CDK4) was used as a loading control. Each differentiation marker gene was normalized to CDK4. C, Quantification of protein expression for 4 to 6 experiments. Results are expressed as mean± SEM. *P=0.01 compared with early passage.