


Figure 3.
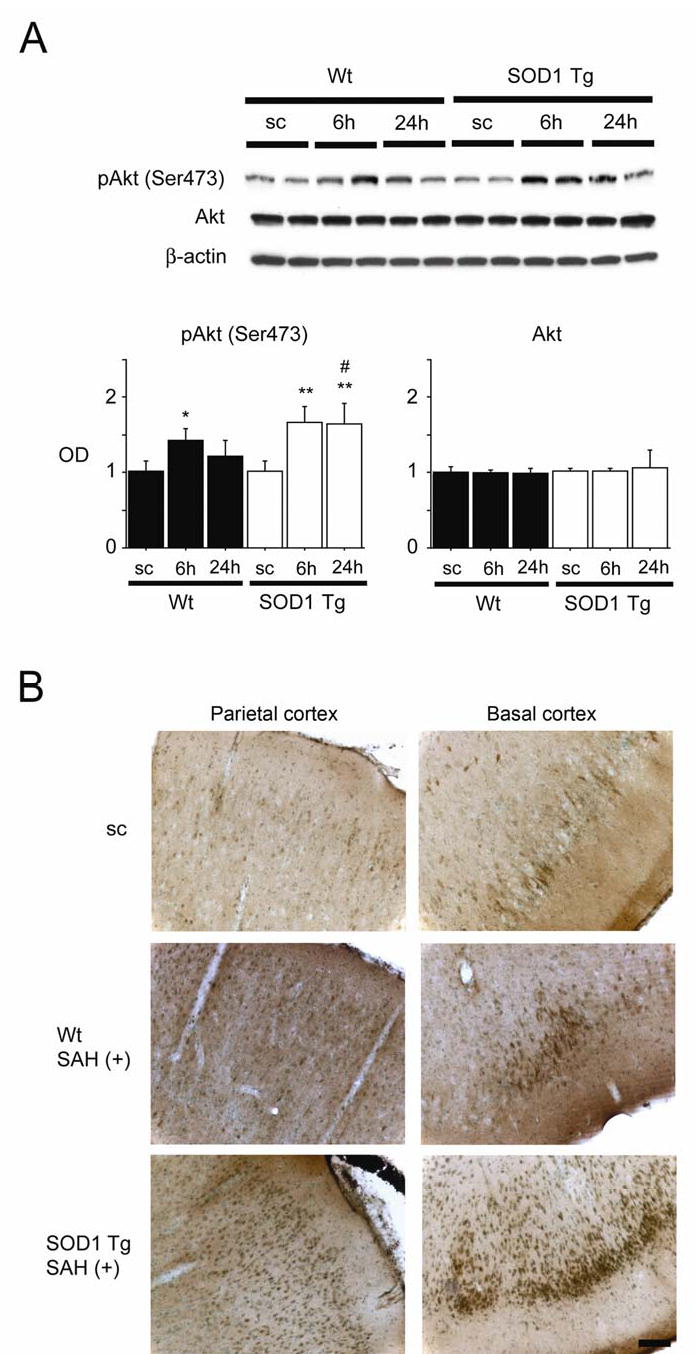
Changes in phosphorylation of Akt (pAkt) after SAH. (A) Western blot analysis showed that pAkt (Ser473) expression in the Wt rats increased significantly at 6 h compared with the sham-operated control (sc) samples (n = 4, *P < 0.05). In the SOD1 Tg rats, pAkt was significantly increased at 6 and 24 h compared with the sham-operated control samples (n = 4, **P < 0.01). In a comparison between the two groups, pAkt was significantly increased at 24 h in the SOD1 Tg rats (n = 4, #P < 0.05). There was no prominent change in Akt. The results of a β-actin analysis are shown as an internal control. OD indicates optical density. (B) Immunohistochemistry for pAkt (Ser473) showed that immunoreactivity became much stronger 24 h after SAH in the parietal and basal cortices of the SOD1 Tg rats compared with the Wt rats. Scale bar represents 100 μm.