


Figure 2.
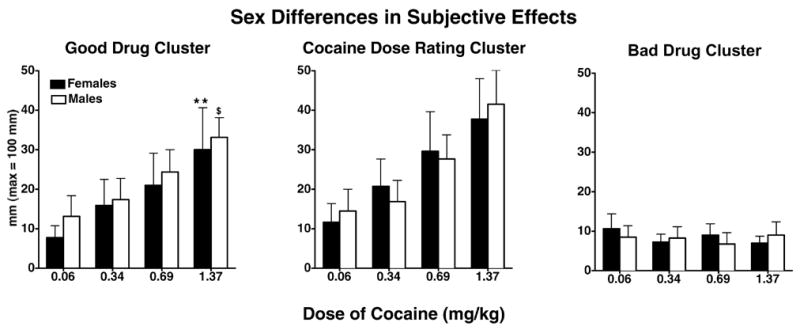
Mean scores on the good drug effect cluster, cocaine dose rating cluster and bad drug effect cluster as a function of cocaine dose and sex. Bars represent the mean + 1 S.E.M. ** represents p ≤ 0.05 when comparing 1.37 mg/kg cocaine in women to 0.06 mg/kg cocaine in women; $ represents p ≤ 0.05 when comparing 1.37 mg/kg cocaine in men to 0.06 mg/kg cocaine in men.