


FIGURE 1.
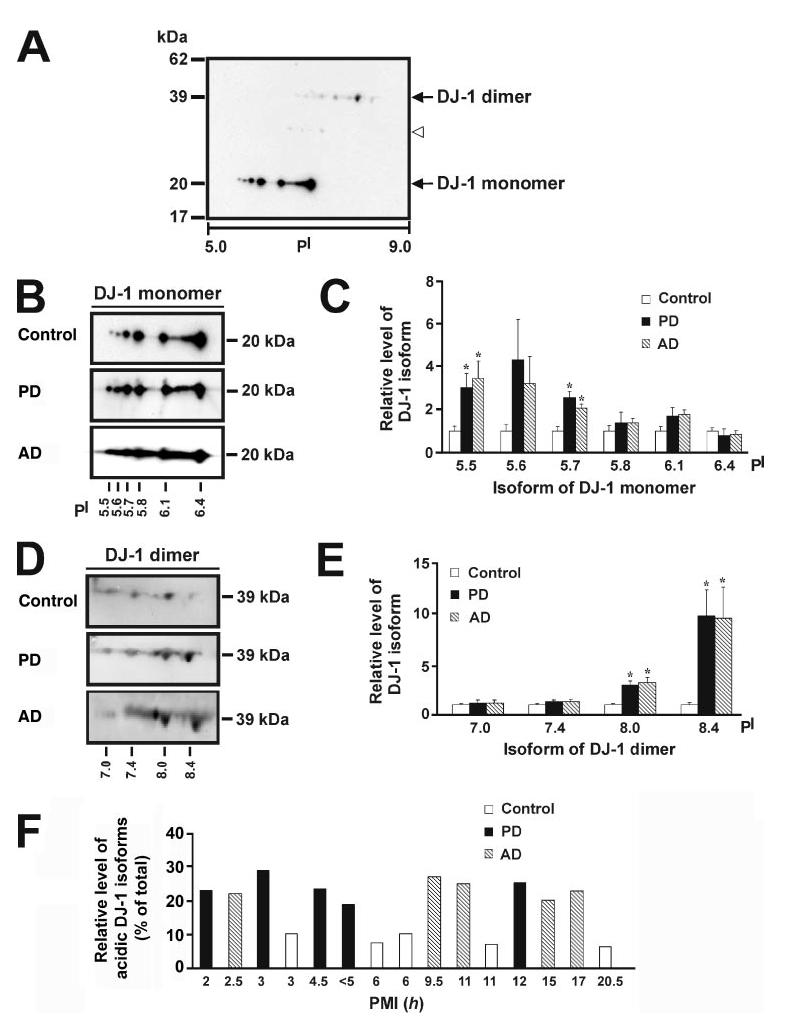
Altered expression of DJ-1 isoforms in PD and AD compared with control brains. A, two-dimensional immunoblot analysis with anti-DJ-1 antibody reveals the presence of multiple pI isoforms of DJ-1 monomer and dimer in human brain. The open arrowhead indicates the presence of weak DJ-1 immunoreactive spots at about 30 kDa (see “Results” for details). B and D, protein samples (350 μg) of control, PD, or AD brains were subjected to two-dimensional gel electrophoresis followed by immunoblotting with anti-DJ-1 antibody for detection of DJ-1 isoforms. C and E, the level of each DJ-1 isoform in PD or AD was quantified using the two-dimensional gel analysis program PD Quest and normalized to the level of the same isoform in the control brains. Values represent the mean ± S.E. for five PD, five AD, and five control individuals. The asterisk indicates a statistically significant ( p < 0.05) increase in the level of the indicated DJ-1 isoform in PD or AD versus the corresponding control. F, the relative level of acidic DJ-1 isoforms was measured by quantification of the intensity of the DJ-1 pI 5.5 and pI 5.7 isoforms and expressed as a percentage of the total level of all DJ-1 monomeric isoforms in each human sample. A histogram plot of relative level of acidic DJ-1 isoforms versus post-mortem interval (PMI) shows no correlation between accumulation of acidic DJ-1 isoforms and post-mortem interval.