


Figure 2.
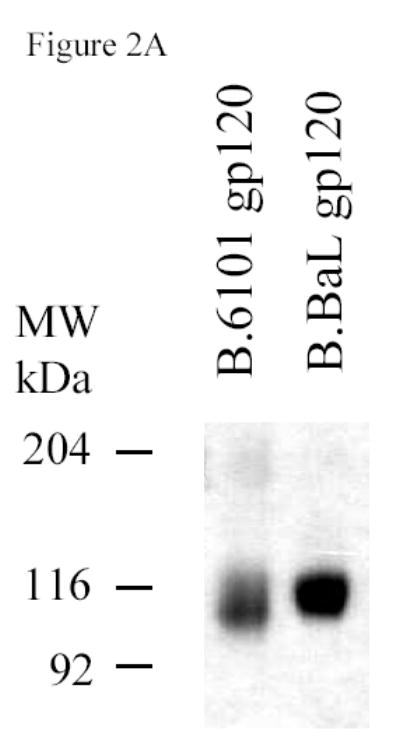
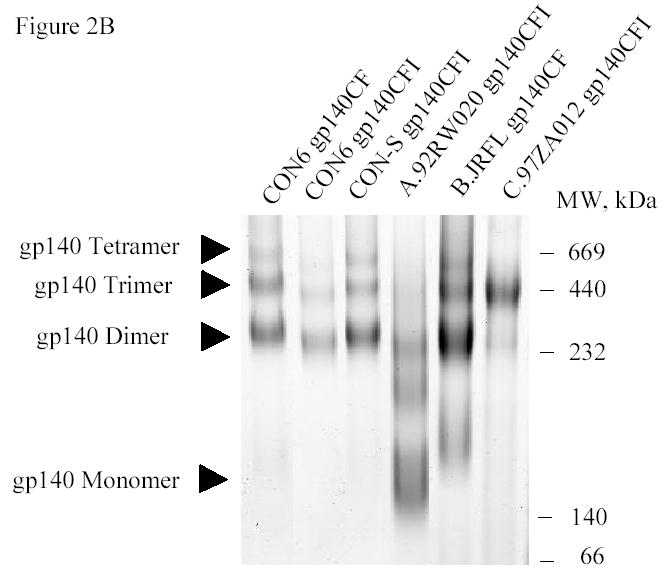
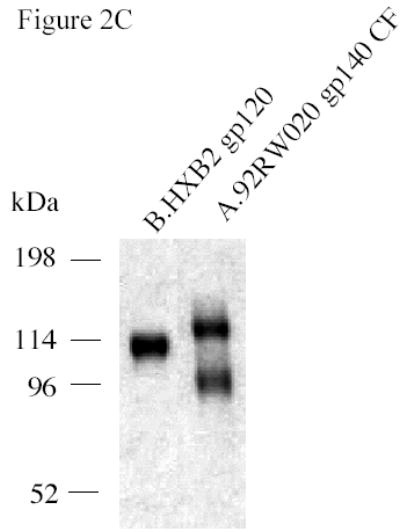
SDS-PAGE and blue native gel analysis of HIV-1 envelope proteins. Panel A shows the results of SDS-PAGE analysis of HIV-1 B.6101 and B.BaL gp120 proteins. HIV-1 gp120 proteins, as indicated on the top of the gel, were fractionated on 4–20% gradient SDS-PAGE under reducing conditions and stained by Coomassie blue. Panel B shows the results of blue native gel analysis of HIV-1 Env gp140 proteins with HIV-1 gp140 proteins indicated on the top of the 3–8% polyacrylamide gels and protein bands of molecular weight markers of 669 (Thyroglobulin), 440 (ferritin), 232 (catalase), 140 (lactate dehydrogenase) and 66 (albumin) kDa indicated on the right hand side of the gel. Arrowheads indicate HIV-1 protein forms (Panel B). Panel C shows SDS-PAGE analysis of the uncleaved HXB2 gp120 Env as a control versus A.92RW020 gp140ΔCF that is approximately 40% cleaved. Gel shows the results of HXB2 gp120 and A.92RW020 gp140ΔCF analyzed under reducing conditions in SDS-PAGE followed by Coomassie blue staining. In this gel, 96kDa band of A.92RW020 Env represents approximately 40% of this preparation. Analysis of 3 separate lots of purified A.92RW020 Env revealed the 96kDa fragment to be 39± 13% of the Env protein preparation.