


Figure 1.
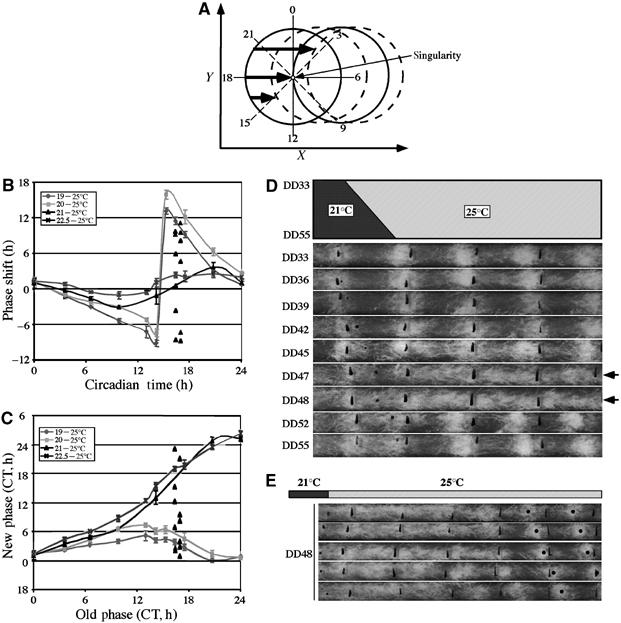
Singularity behavior of the Neurospora circadian conidiation rhythms induced by a temperature step up. (A) A limit cycle model explaining clock resetting behavior. The circle in the middle represent a hypothetical limit cycle of the oscillator in constant condition, whereas other circles indicate the clock resetting curves after stimuli of different strength at different time points. Bold arrows indicate stimuli of different strength that can increase of the level of state variable X. The CT, the shape of the limit cycle and the time point when singularity behavior occurs in this model are hypothetical and not based on experimental data. (B, C) PRCs (B) and PTCs (C) for different temperature step ups. For 21–25°C temperature step up, the phase shifts (B) or the new phases (C) of individual race tubes for DD47 and DD48 are shown. A wild-type Neurospora strain was used in these experiments. (D) Race tube assays showing that a 21–25°C temperature step up induced arrhythmicity at around DD48. The black lines on race tubes mark the growth fronts of Neurospora every 24 h. (E) Race tube assays showing the random distribution of phases after the singularity behavior.