


FIG. 5.
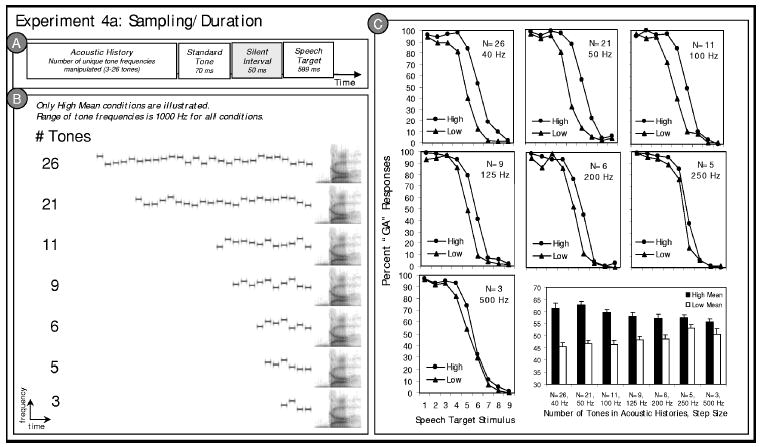
Stimulus structure and results of Experiment 4a. (a) Schematic illustration of the experiment 4a stimulus structure; (b) example spectrograms illustrating a high mean stimulus token from each experiment 4a condition. Low mean conditions (not illustrated) follow the same pattern across conditions. (c) Listeners’ average “ga” categorization responses to the /ga/ to /da/ series stimuli in the context of preceding high and low mean acoustic histories are plotted for each of the seven conditions of Experiment 4a. The bar graph in the lower right corner illustrates the same data collapsed across speech target stimulus.