


Figure 2.
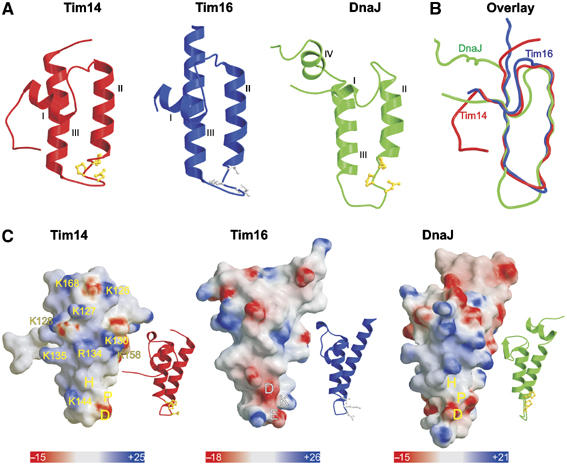
Topology and charge patterns of Tim14 and Tim16. (A) Ribbon presentations of the J domain of Tim14 (left panel) and the J-like domain of Tim16 (central panel). For comparison, the J domain of DnaJ from E. coli is included (right panel). Helices I–III are indicated. HPD motifs in the J domains are presented as balls-and-sticks models and colored in yellow. Corresponding DKE motif in Tim16 is colored in gray. As compared to the J domain of DnaJ, Tim14 and Tim16 lack helix IV. (B) Superposition of the J and J-like domains of Tim14, Tim16 and DnaJ. (C) Surface representations of Tim14, Tim16 and DnaJ. Ribbon presentations of the same orientation are shown as insets. The domains are rotated clockwise by 80° relative to the representations in (A) to bring helix II to the front. Surface colors indicate positive (intense blue) and negative electrostatic potentials (intense red) with the scale bar giving the actual potentials in kT/e. Lys and Arg residues of Tim14 contributing to the positive surface charge distribution are indicated.