


Figure 2.
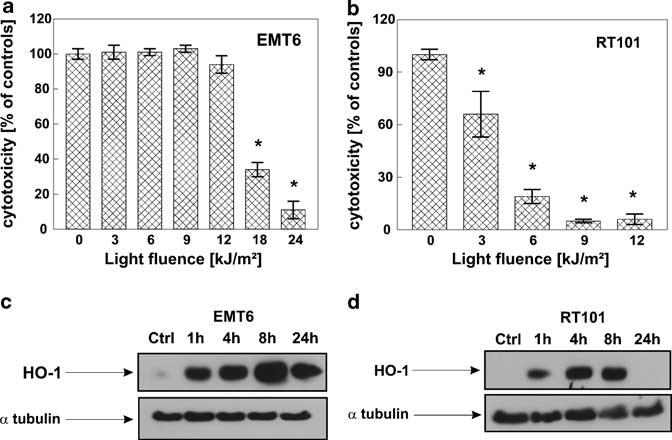
Higher HO-1 expression after PDT correlates with resistance to PDT treatment. Two different murine cell lines EMT6 (a) and RT101 (b) were seeded onto 35 mm plates at the concentration of 2.5 × 10⁵ cells/3 ml/dish, incubated for 24 h with 10 μg/ml Photofrin and then exposed to different doses of light, 3–24 kJ/m2 for EMT6 cells and 3–12 kJ/m2 for RT101 cells. Immediately after PDT, cells were trypsinized and seeded onto 96-well plate in the dilution of 1:50 in eight repeats. Following 24 h of incubation, the cytotoxic effects were measured by crystal violet staining. The bars represent percent cytotoxicity versus untreated controls. Data refer to mean±s.d. *P<0.03 versus controls (Student's t-test). EMT6 (c) and RT101 (d) cells were exposed to 10 μg/ml Photofrin for 24 h and then to different light doses, resulting in 60% cytotoxicity, according to the crystal violet staining test results. Namely, EMT6 cells were exposed to light fluence of 18 kJ/m2, whereas RT101 cells to 4.5 kJ/m2. After indicated times of incubation, total cell lysates were prepared, and Western blot analysis was performed using anti-HO-1 or anti-α-tubulin antibodies.