


Figure 8.
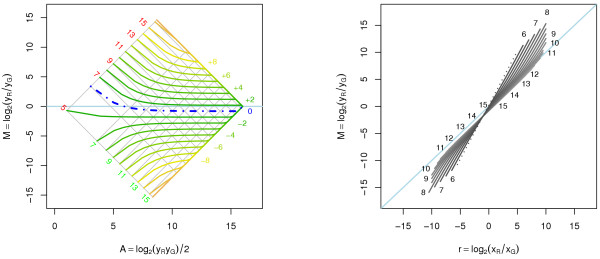
Affine transformation with negative translation. Affine transformation of the red and the green signals with negative translation where (aG, aR) = (-87, -24), (bG,bR) = (1.4,0.8). Left: Log-ratios as a function of log-intensities for certain fold changes. Right: Translated log-ratios versus true log-ratios. The slope of a line fitted in the M versus M plot will be larger than one, which is due to the negative translation. The grid and the fold-change curves in the left graph, and the intensity curves in the right graph have been truncated such that xR,xG ≥ 1.