


FIG. 1.
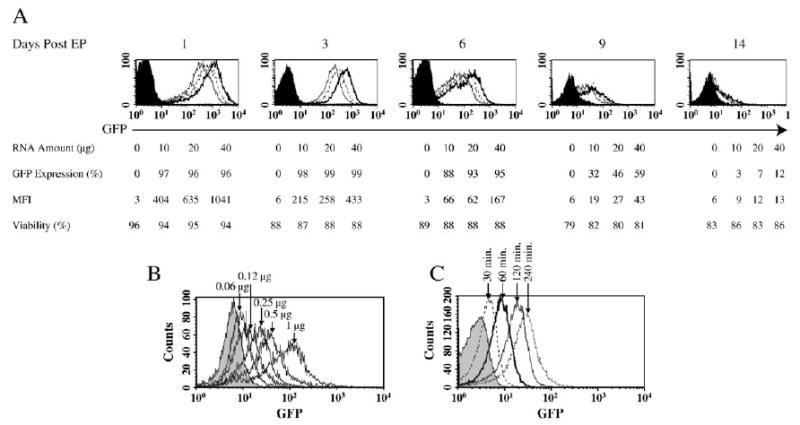
GFP expression in electroporated human PBLs. (A) 5 × 10⁶ stimulated human PBLs were electroporated with increasing amounts of in vitro-transcribed (IVT) GFP RNA at 0 (electroporation without RNA, filled histogram), 10 (open histogram with solid line), 20 (open histogram with dotted line), and 40 μg (open histogram with dark solid line). Viability is the percentage of cells that excluded PI in the total population. GFP expression and mean fluorescence intensity (MFI) of the viable cells were measured on the days indicated. (B) Two times dilution of GFP RNA (starting from 1 μg) as indicated was electroporated into 1 × 10⁶ (in 50-μl volume) stimulated PBLs. 24 h postelectroporation, GFP expression was detected by flow cytometry. (C) Stimulated PBLs were electroporated and immediately cultured in prewarmed culture medium (CM). At various time points as indicated, the samples were collected and fixed in 2% paraformaldehyde at 4°C and subjected to flow cytometry analysis to detect the GFP expression.