


Figure 6.—
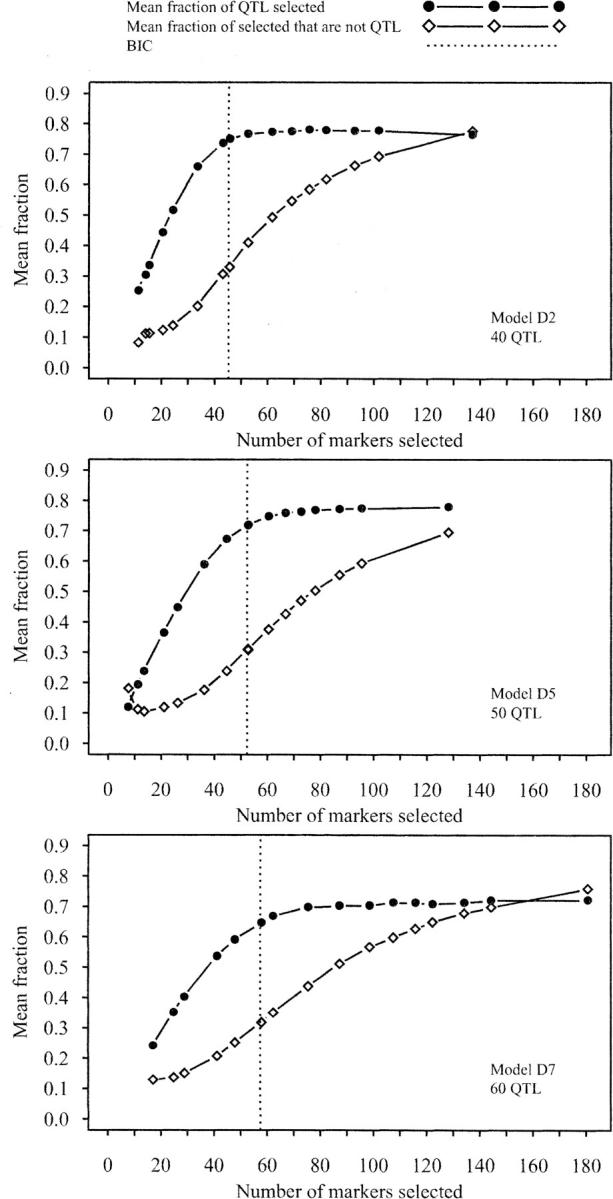
MAXR analysis of simulated data for three models. These plots show the relationship between the mean number of markers in a selected set and two measures of the quality of those markers. One measure is the fraction of known QTL that are found in the set and the other measure is the fraction of markers in the set that are not QTL. The mean of each variable is over 100 replicate simulations. The standard errors (SE) of the means are small (maximum value of 0.01 for both quality measures and 1 for number selected). The dotted line is the mean number of markers selected by the BIC.