


Fig. 3.
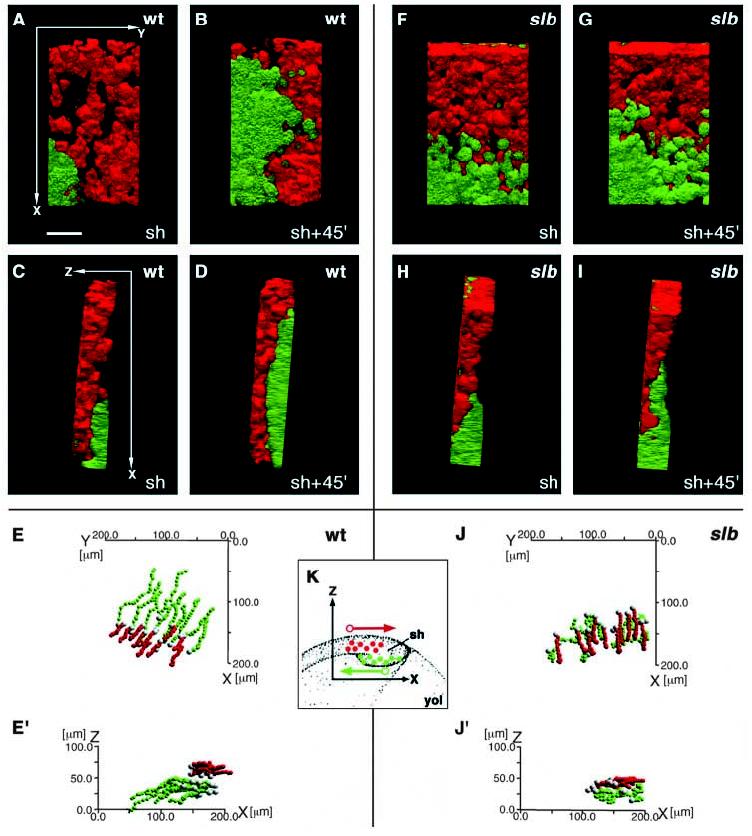
Movement of axial hypoblast (presumptive prechordal plate) cells in dorsal regions of the germ ring (shield) is disturbed in slb mutant embryos at the onset of gastrulation. Embryos expressing GFP (green) under the control of the goosecoid (gsc) promotor in prechordal plate precursor cells were scatter labelled with rhodamine (red) in epiblast cells overlying the presumptive prechordal plate and followed in 3D over time by dual channel confocal microscopy. (A-D,F-I) Prechordal plate precursor cells (green) and overlying epiblast cells (red) in wild-type (A-D) and slb (F-I) gscGFP embryos at shield stage (A,C,F,H) and 45 minutes (45′) later (B,D,G,I). Ventral views (A,B,F,G) and lateral views with ventral to the right and dorsal to the left (C,D,H,I). In all pictures, anterior is to the top and posterior to the bottom. The axes of orientation are shown in panels A and C. (E,E′,J,J′) Track diagrams showing the movements of prechordal plate precursor cells (green) and epiblast cells (red) in wild type (E,E′) and slb gscGFP embryos (J,J′) along the x (anterior-posterior) and y (medio-lateral) axes (E,J) and along the x and z (dorsal-ventral) axes (E′,J′) of the embryo. The positions of the geometric centre of the cell (the centroid) were measured in 3D at 4-minute intervals and plotted as a single dot. Each line represents the track of one cell, with the first timepoint depicted in white. The net movement of the epiblast cells is along the +x (posterior) direction and that of prechordal plate precursor cells along the −x (anterior) direction. Note that the x, y and z axes depict the global coordinates within the gastrula, whereas in Figs 4, 5 and 7, these axes show the coordinates relative to the movement direction of individual cells. (K) Schematic diagram showing the orientation of the region analyzed in wild-type and slb embryos and the net movement direction of the cells (arrows) with respect to the x and z axes. The y axis is perpendicular to x and z and is not depicted in this diagram. Epiblast cells in red, hypoblast cells in green. Note that a left-handed coordinate system has been used. sh, shield; yol, yolk. Scale bar in A: 50 μm.