


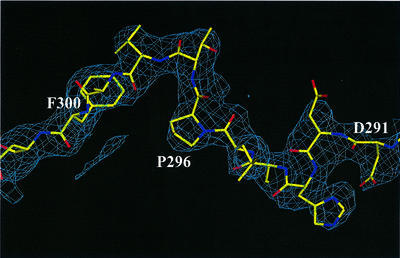
Fig. 2. A representative example of electron density in the solvent-flattened 2.7 Å experimental map calculated with SHARP/SOLOMON. A region that corresponds to the interdomain linker (aa 290–300) in molecule I is shown. The protein density is shown in blue. Superimposed on the map is the refined model of the protein. Contours are drawn at the 1.25σ level.