


FIGURE 4.
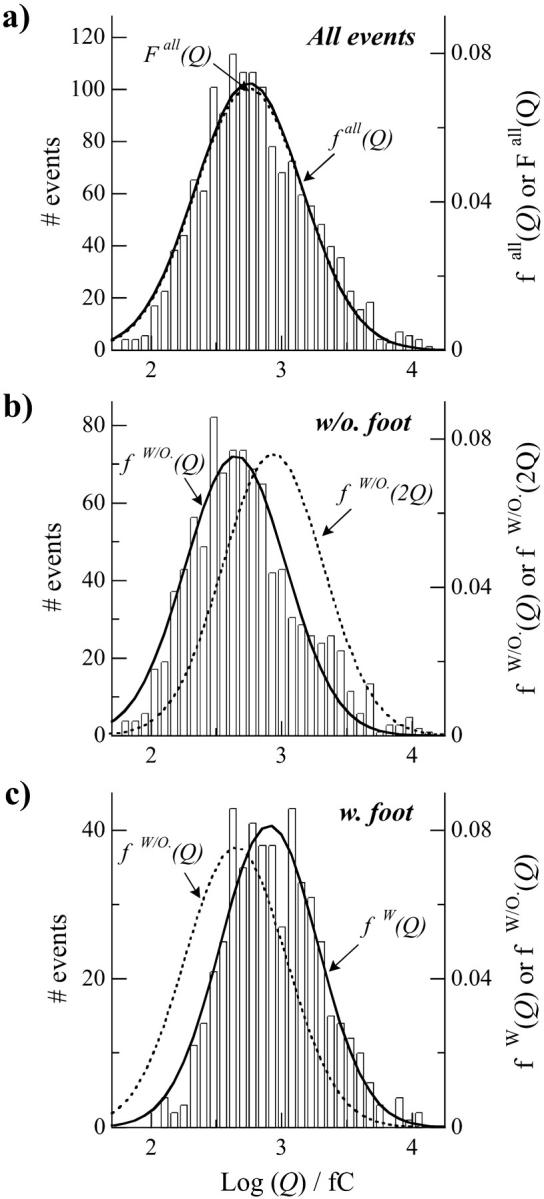
Histograms of the log (Q) values for all spikes (a), and separately for the ones without a foot (b) and the ones with a foot (c). Each distribution is presented as a function of events number (left y axis) or the statistical probability density (right y axis) and is fitted by a single Gaussian distribution, named fall(Q) for all spikes, fW/O(Q) for spikes without a foot, and fW/O(Q) for spikes with a foot. The parameters for the Gaussian distributions are 2.75 ± 0.02 and 0.82 ± 0.02 for all spikes, 2.65 ± 0.02 and 0.77 ± 0.02 for spikes without a foot, and 2.91 ± 0.02 and 0.75 ± 0.02 for spikes with a foot for their center position (log (Q)max) and their half-width, σ, respectively. Graphs are presented in a column so that one can easily observe the shift between centers of the different distributions. The comparison between the Gaussian fitting fW/O(Q) and the distribution for spikes with a foot in c shows the differences of vesicular quantal size between spikes with and without a foot. In b, a mathematically constructed Gaussian distribution fW/O(2Q) was created using the same conditions but applied to a mean charge of 2Q instead of Q (parameters: log (Q)max = 2.95; σ = 0.77). fW/O(2Q) and fW(Q) coincide well within the accuracy of their determination, showing that vesicles leading to the events with a foot contain on average twice the quantity of catecholamines of the vesicles that lead to events without foot. Finally, we constructed a Gaussian distribution Fall(Q) corresponding to all spikes by the combination of the two individual distributions fW/O(Q) and fW/O(2Q), weighted each as a function in the overall of the percentage of spikes without and with foot, respectively, 65% and 35%. Fall(Q) is compared in a with the distribution of log (Q) values.