


Figure 4.
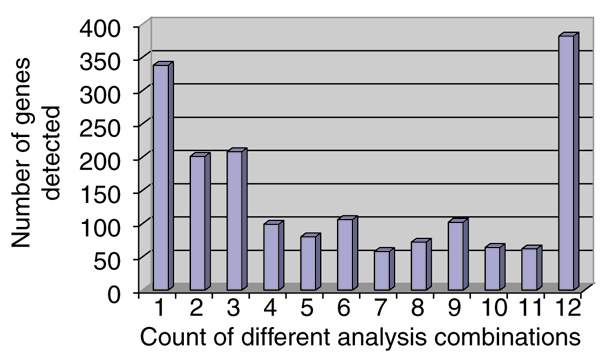
Numbers of genes detected by one or more of the 12 possible combinations between normalization and statistical analysis. x-axis, count of different combinations between normalization and statistical algorithm, y-axis, number of genes detected as differentially expressed in the respective number of different analysis combinations. A total of 12 different analysis combinations (four normalization procedures times three methods to detect differentially expressed genes) have been investigated.