



Abstract
Natural killer (NK) cells function by eliminating virus-infected or tumor cells. Here, we identified a NK lineage-biased progenitor population, referred to as early NK progenitors (ENKP), which developed into NK cells independently of common precursors for ILCs (ILCPs). ENKP-derived NK cells (ENKP_NK cells) and ILCP-derived NK cells (ILCP_NK cells) were transcriptionally different. We devised combinations of surface markers that identified highly enriched ENKP_NK and ILCP_NK cell populations in wild-type mice. Furthermore, Ly49H+ NK cells that responded to mouse cytomegalovirus (MCMV) infection primarily developed from ENKPs, whereas ILCP_NK cells were better IFN-γ producers after infection with Salmonella and herpes simplex virus (HSV). Human CD56dim and CD56bright NK cells were transcriptionally similar to ENKP_NK cells and ILCP_NK cells, respectively. Our findings establish the existence of two pathways of NK cell development that generate functionally distinct NK cell subsets in mice, and further suggest these pathways may be conserved in humans.
Innate lymphoid cells (ILCs) include helper ILCs which secrete cytokines and NK cells which help control viral infection1. ILCs develop from Lin−Kit+α4β7−Flt3+IL-7Rα+ ALPs (all-lymphoid progenitors). Downstream of ALPs, the earliest defined ILC-specified progenitors are Lin−Kit+Tcf7YFP+α4β7+Thy1.2− EILPs (early innate lymphoid progenitors), which give rise to Lin−Kit+Tcf7YFP+α4β7+Flt3−Thy1.2+ ILCPs (ILC precursors), a progenitor population for helper ILCs that retains NK-lineage potential2,3,4,5. Because the transcription factor PLZF is highly expressed in ILCPs, but not in upstream progenitors or ILCs, it allowed lineage tracing of ILCP-derived cells3. NK cells were labeled at a lower ratio than helper ILCs in PLZF-Cre Rosa26-reporter mice, suggesting some NK cells develop independently of ILCP3. Lin−2B4+CD27+Flt3−CD122+ rNKPs (refined NK progenitors) are also traced by PLZF at intermediate levels, suggesting some rNKPs may develop from ILCPs6,7. Thus, the developmental pathways between ALPs and mature NK cells are poorly defined.
Mouse and human NK cells are heterogeneous8,9,10,11,12. In C57BL/6 mice ~50% of mature NK cells express Ly49H that recognizes mouse cytomegalovirus (MCMV) antigen m15713,14. Here, we characterize a mouse bone marrow (BM) progenitor population referred to as early NK progenitors (ENKPs). ENKPs were biased to NK cell fates in vitro and in vivo, and developed into NK cells independently of ILCPs. ENKPs but not ILCPs efficiently gave rise to Ly49H+ NK cells that expanded upon MCMV infection. We identified NK cell populations that were enriched for ENKP-derived (ENKP_NK cells) or ILCP-derived NK cells (ILCP_NK cells) in C57BL/6 mice by surface markers. ILCP_NK cells were more robust IFN-γ producers during infection with Salmonella or herpes simplex virus (HSV). Our data revealed the existence of parallel developmental pathways that give rise to functionally distinct NK cell subsets.
Results
Early NK cell development in BM
We performed single-cell RNA sequencing (scRNA-seq) on Lin−CD27+2B4+CD122+ cells sorted from BM, that were likely to contain NK cell lineage progenitors, as CD27 and 2B4 are expressed on ALPs, EILPs and ILCPs15,16. We also performed scRNA-seq on sorted and pooled ALPs, EILP, ILCP and Lin−CD25+Sca1+ ILC2P, and separately, LinT−NK1.1+CD122+ group 1 ILCs from BM (Fig. 1a and Extended Data Fig. 1a,b)15,16. We defined Flt3+Il7r+ ALP, Il2rb(encoding CD122)loNfil3+Tcf7+Id2lo EILP, Flt3−Il7r+Tcf7+Zbtb16hi ILCP, Il2ra+Il7r+Gata3+ ILC2P, Klrb1c+Eomes+Tbx21+ NK cells and Klrb1c+Eomes−Tbx21+ ILC1 clusters (Fig. 1b). The UMAP revealed that the ILCP cluster, which was Zbtb16hi (encoding PLZF), overlapped with some CD122+ progenitor cells, which included rNKPs (Figure 1a,b and Extended Data Fig. 1b,c), suggesting overlap between PLZFhi rNKPs and ILCPs. A cluster identified as Il2rb+Flt3−Zbtb16lo was named rNKP’ (Fig. 1a,b).
Fig. 1. Characterization of early NK cell development in BM.
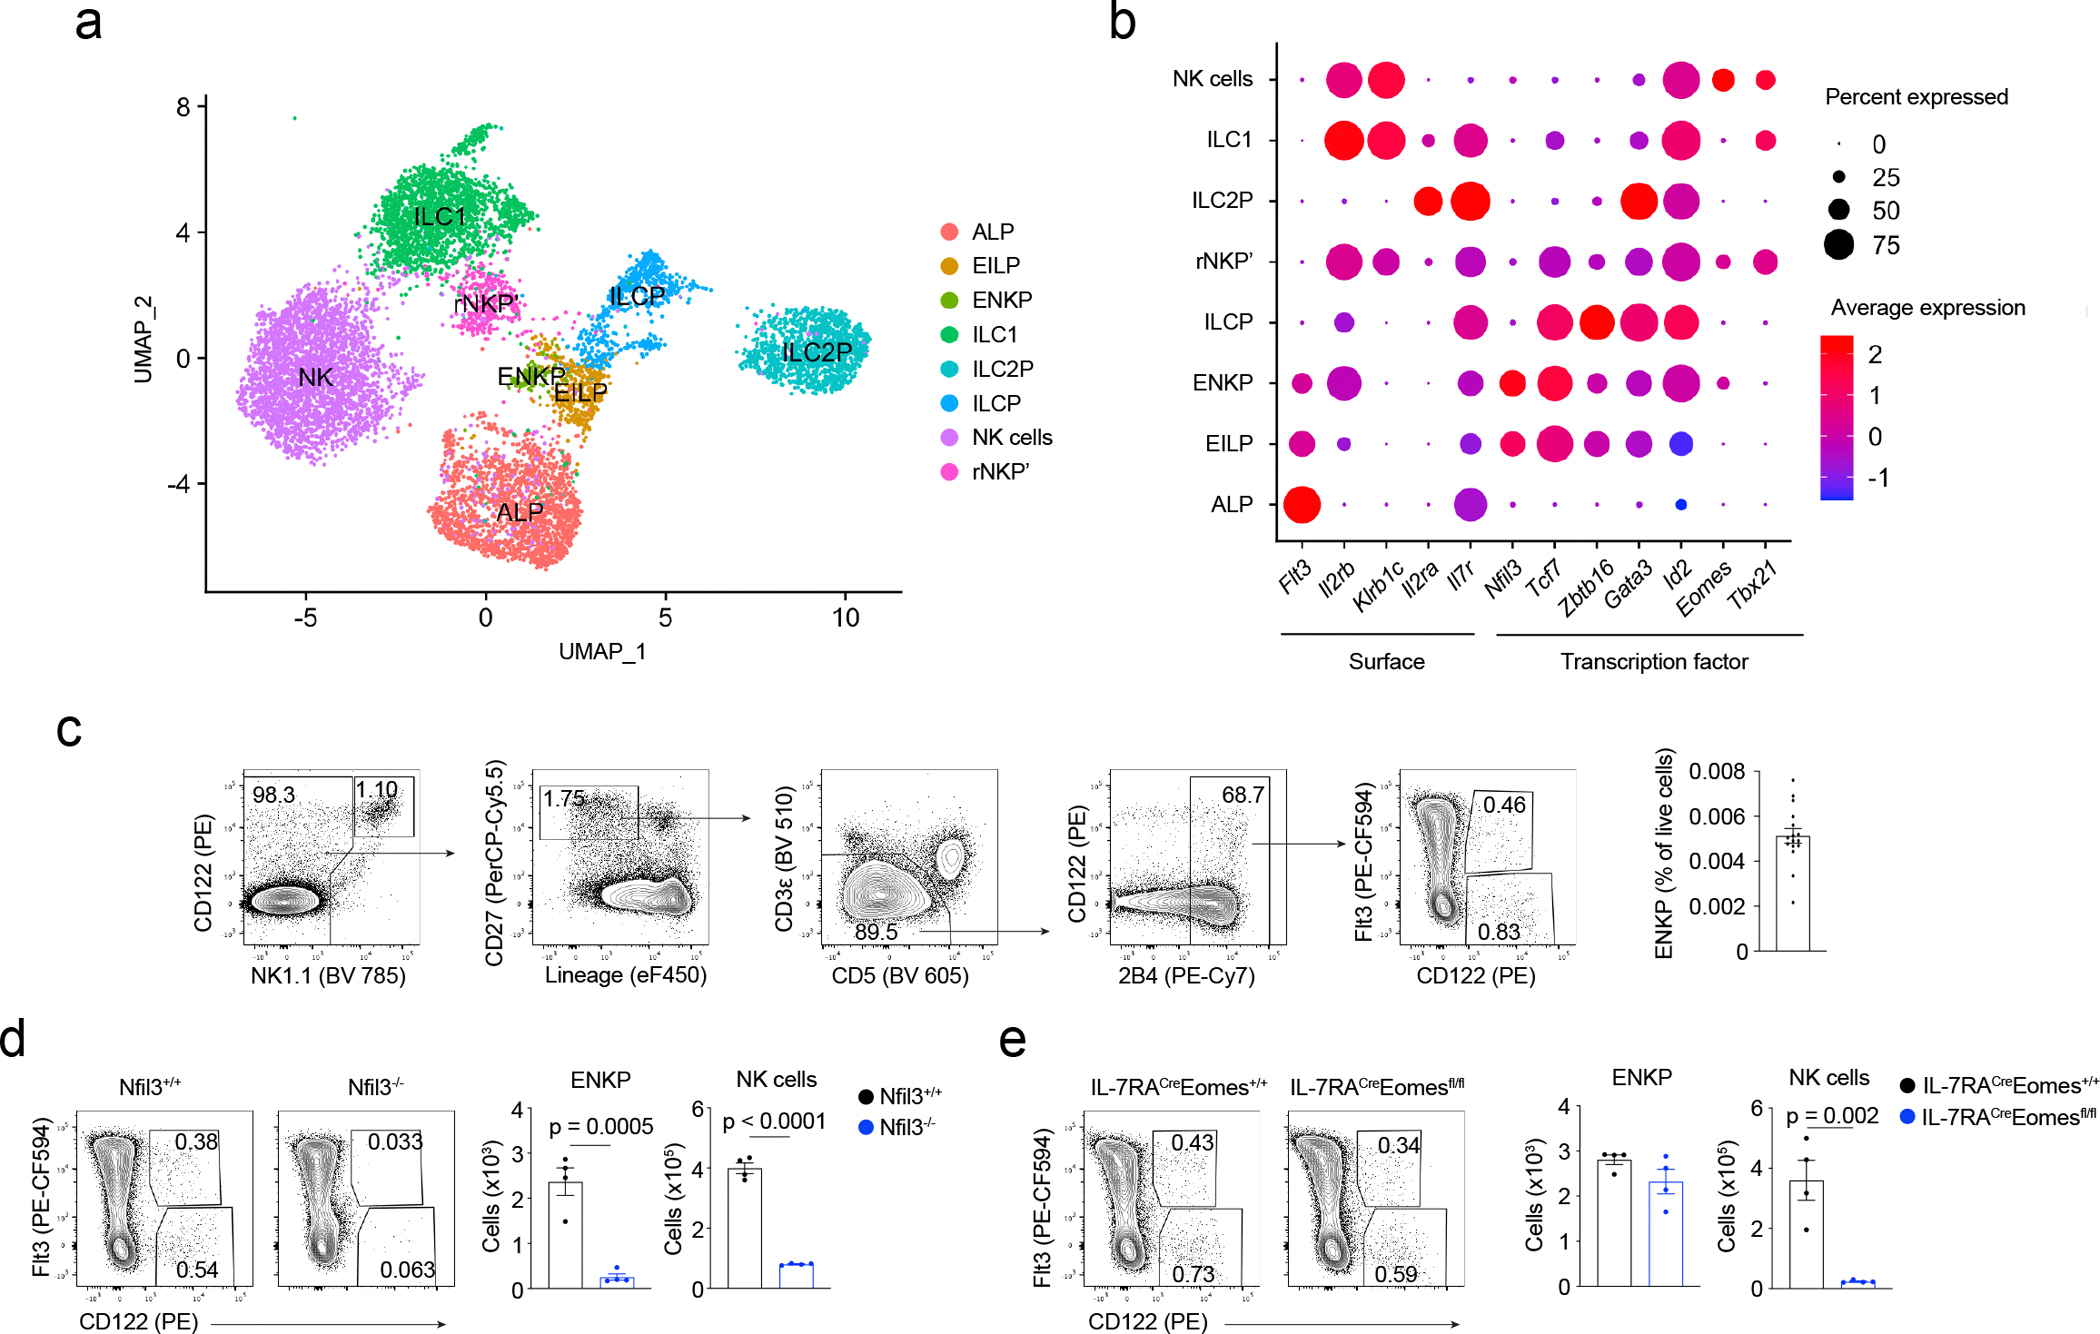
a - b, scRNA-seq of BM cells: UMAP (a), and dotplots (b) of expression of surface genes and transcription factors grouped by clusters in a. c, Gating strategy and frequency of ENKPs combined from 3 independent experiments. n = 16 mice. d, Representative flow plots of ENKPs and quantification of ENKPs and NK cells in BM of Nfil3−/− mice, n = 4. Combined data from 2 independent experiments. e, Representative flow plots of ENKPs and quantification of ENKPs and NK cells in BM of Eomes−/− mice, n = 4. Combined data from 2 independent experiments. For c, d and e, data are mean ± s.e.m, and for d and e, statistical analysis used two-tailed unpaired Student’s t-tests.
A Il2rb+Flt3+ cluster within CD122+ progenitor cells formed close to the EILP cluster (Fig. 1a,b and Extended data Fig. 1b). Flt3 is expressed by ALP and EILP, but downregulated in downstream progenitors such as ILCP15, suggesting the Il2rb+Flt3+ NK cell progenitor cluster could be an early-stage precursor for NK cells that we tentatively referred to as “early NK progenitor” (ENKP). The ENKP cluster did not express Klrc1, Klrc2 and Klrc3 (encoding NKG2A, NKG2C and NKG2E) (Extended Data Fig. 1d), suggesting ENKPs were distinct from aceNKPs17.
We predicted developmental relationships between ALP, EILP, ENKP, rNKP’, ILCP, and NK cell clusters using pseudotime reconstruction. One sequence of predicted development (lineage 1) was ALP->EILP->ENKP->rNKP’->NK (Extended Data Fig. 1e), which was independent of ILCP. ILC2 development15 was detected as ALP->EILP->ILCP->ILC2P (lineage 2)(Extended Data Fig. 1e). We did not detect an ILCP-dependent pathway of NK cell or ILC1 development (Extended Data Fig. 1e), suggesting intermediate populations may be missing in our dataset, consistent with evidence indicating ILCPs leave the BM and differentiate at extramedullary sites18,19. In lineage 1, Flt3 was highly expressed in ALP and EILP clusters, maintained in the ENKP cluster, but downregulated in rNKP’ (Extended Data Fig. 1e), whereas Il2rb was upregulated starting from ENKP cluster (Extended Data Fig. 1e). These data suggested the existence of an ILCP-independent pathway of NK cell development in BM, and identified ENKPs as a candidate precursor for NK cells.
Consistent with the Il2rb+Flt3+ phenotype of the ENKP cluster identified by scRNA-seq, flow cytometry identified a Lin−NK1.1−CD5−CD3ε−CD27+2B4+Flt3+CD122+ population in the BM of C57BL/6 mice (Fig. 1c) that we also refer to as ENKP. ENKPs represented ~0.005% of live cells in BM, similar to EILP2 (Fig. 1c) and were different from rNKP6. Numbers of ENKPs in BM were greatly reduced in Nfil3−/− mice, but were intact in Eomes−/−, Tcf7−/− and Gata3−/− mice (Fig. 1d,e and Extended Data Fig. 2a,b). NK cell numbers in BM were significantly reduced in Nfil3−/−, Eomes−/− and Tcf7−/− mice, but were intact in Gata3−/− mice, as expected (Fig. 1d,e and Extended Data Fig. 2a,b)2,20,21,22. Thus, among the transcription factors assessed, only Nfil3 was required for ENKP development. These results indicated ENKPs were not downstream of ILCPs, as ILCPs do not develop in Tcf7−/− 16 or Gata3−/− mice15,23. ENKPs had high expression of α4β7 and Kit, low expression of IL-7Rα and did not express Thy1.2 (Extended Data Fig. 2c). Approximately 70% of ENKPs were fate-mapped by Il7r (Extended Data Fig. 2d), similar to the ratios of Il7r-fate-mapping in ALPs and EILPs15, indicating ENKPs developed from Il7r-expressing lymphoid progenitors, as predicted for NK cells24. These results suggested ENKPs could represent an early NK progenitor population.
ENKPs are NK lineage-biased progenitors
We seeded ENKPs or ILCPs on OP9 stromal cells. At day 7 of culture with the cytokines stem cell factor (SCF), Flt3L, IL-7 and IL-2, both ILCPs and ENKPs gave rise to NK1.1+ cells (Fig. 2a), which include NK cells and ILC1s. However, ENKPs had very limited potential for ICOS+ ILC2/ILC3s, in contrast to ILCPs, which efficiently gave rise to ICOS+ ILC2/ILC3s (Fig. 2a). Thus, ENKPs were an NK cell-biased progenitor population. We sought to determine the lineage potential of single ENKPs in vitro. To distinguish NK cells from ILC1s in vitro, we used EomesGFP reporter mice to identify Eomes-GFP+ NK cells, and CD200R to identify ILC1s, as CD200R is highly expressed in ILC1s in vivo25. In pilot experiments, when we cultured mature Eomes-GFP− ILC1s and Eomes-GFP+ NK cells on OP9 cells for 7 days, Eomes-GFP− ILC1s remained CD200Rhi and Eomes-GFP−, whereas NK cells were Eomes-GFP+ (~90%) and did not express CD200R (Extended Data Fig. 3a). Among the ICOS+ cells, we used α4β7 to further distinguish ICOSloα4β7+ ILC3s and ICOShiα4β7− ILC2s (Fig. 2b). The majority of ENKP-derived clones (74%) contained NK1.1+Eomes-GFP+CD200R− NK-lineage cells, and 54% of ENKP clones contained only NK-lineage cells, whereas most ILCP-derived clones (92%) contained only helper ILC lineages (NK1.1+Eomes-GFP−CD200R+ ILC1, ILC2s or ILC3s)(Fig. 2c and Extended Data Fig. 3b). Thus, compared with ILCPs, ENKPs were NK cell lineage-biased progenitors in vitro. Mature NK cells generated negligible numbers of NK cells in vitro (Extended Data Fig. 3c), indicating that results obtained with ENKP and ILCPs could not be attributed to NK cell contamination. We cultured ENKPs in vitro with and without Flt3 ligand (Flt3L) to assess whether their NK-lineage potential depended on the expression of Flt3. ENKPs cultured without Flt3L generated fewer NK1.1+Eomes-GFP+CD200R− NK cells than ENKPs cultured with Flt3L, although the results did not reach statistical significance (Extended Data Fig. 3d), indicating that Flt3 signaling may affect ENKP expansion.
Fig. 2. ENKPs are early NK-lineage biased progenitors.
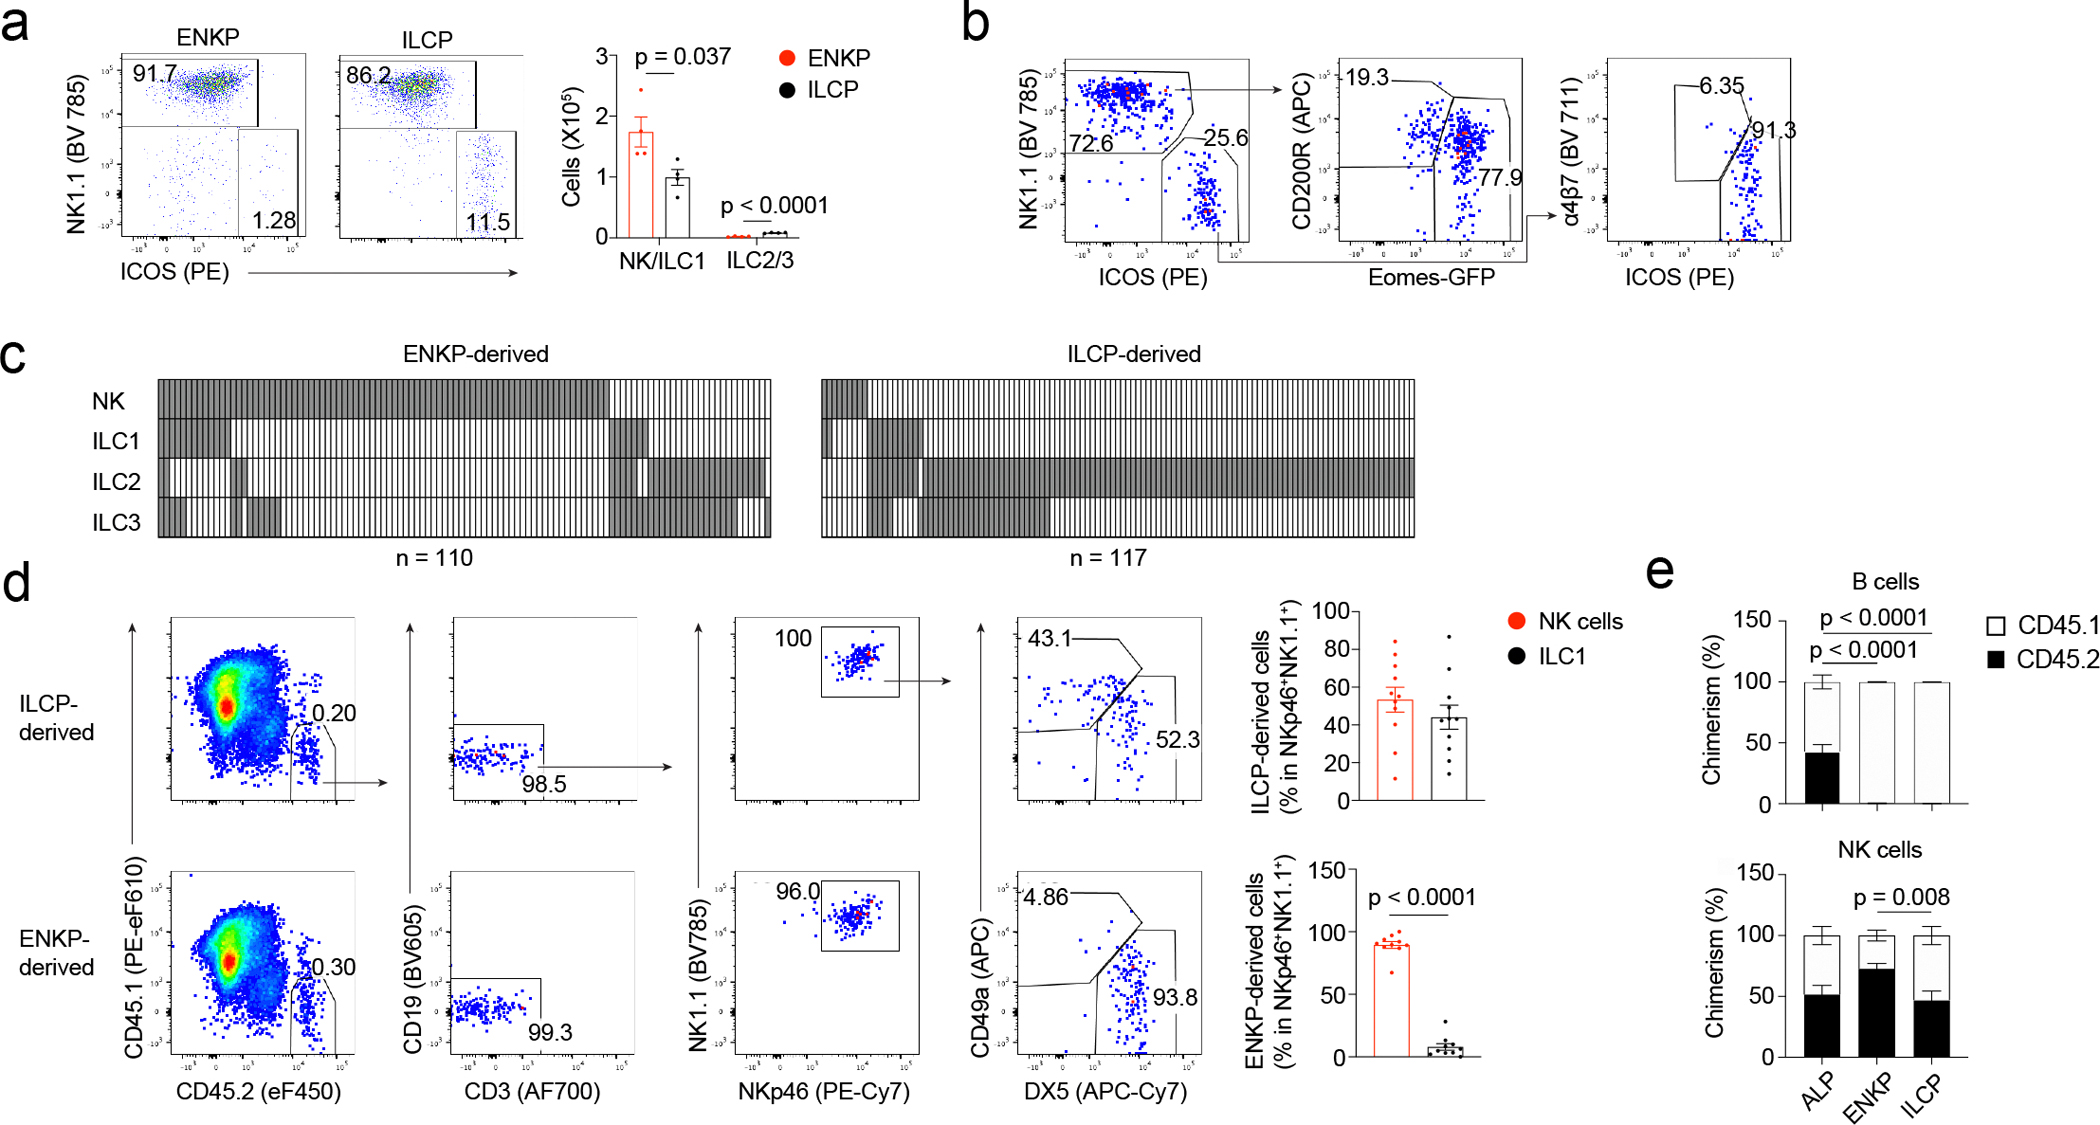
a, Representative flow plots and quantification of in vitro differentiated ILCs, n = 4. Representative data from 3 independent experiments. b, Gating strategy of in vitro clonal assay for ILC lineage potential. c, Results of individual positive clones combined from 2 independent experiments. Each column represents one well, with detected ILC lineages in grey. n is number of wells. d, Flow plots and quantification of group 1 ILCs in liver from ILCP (n = 10) or ENKP-transferred (n = 10) NSG mice combined from 3 independent experiments. e, Quantification of chimerism in spleen combined from 2 independent experiments. CD45.1+ cells are ALP competitors-derived cells. CD45.2+ cells are ALP-derived, ENKP-derived or ILCP-derived cells. ALP group, n = 8; ENKP group, n = 9; ILCP group, n = 8. For a, d, e, data are mean ± s.e.m, and statistical analysis used two-tailed unpaired Student’s t-tests, without any adjustment for multiple comparisons.
We transferred ENKPs or ILCPs into NOD SCID gamma (NSG) mice and assessed the frequency of donor-derived CD45.2+CD3−CD19−NK1.1+NKp46+DX5+CD49a− NK cells and CD45.2+CD3−CD19−NK1.1+NKp46+DX5−CD49a+ ILC1s within CD45.2+CD3−CD19−NK1.1+NKp46+ group 1 ILCs in liver. Six weeks later, ILCPs gave rise to NK cells and ILC1s, whereas ENKPs generated primarily NK cells (Fig. 2d). When co-transferred with an equal number of ALPs as competitors, ENKPs generated NK cells more efficiently than ILCPs in spleen and liver after 6 weeks (Fig. 2e and Extended Data Fig. 3e). ALPs, but not ILCPs or ENKPs, gave rise to B cells (Fig. 2e; Extended Data Fig. 3f–h). Further, the development of both CD45.2+ ENKP-derived NK cells (ENKP_NK cells) and CD45.2+ ILCP-derived NK cells (ILCP_NK cells) but not CD45.2+ ILC1s, depended on Eomes in vivo in spleen (Extended Data Fig. 3i), indicating ILCP_NK cells are distinct from ILC1s26,27. Thus, ENKPs were NK-lineage-biased progenitors which can give rise to NK cells efficiently in vivo.
Next, we used PLZF-Cre Rosa26-YFP reporter mice to assess the developmental relationship between ILCP and ENKP. To eliminate the background labeling of PLZF-YFP (as PLZF is expressed before the specification of hematopoietic lineages3) we transferred CD45.2+PLZF-YFP−Lin−Kit+ hematopoietic progenitors from PLZF-Cre Rosa26-YFP reporter mice into lethally irradiated CD45.1+ wild-type mice (PLZF lineage-tracing chimeras). At 12–16 weeks after transfer, NK cells and ILC1s in the liver were labeled at ratios of ~20% and ~65% (Fig 3a), respectively, as reported3,7, while ENKPs were PLZF-YFP− (Fig 3a), indicating they did not develop from ILCPs. Next, we transferred PLZF-YFP− ENKPs, PLZF-YFP− ILCPs or PLZF-YFP− ALPs from PLZF-Cre Rosa26-YFP reporter mice into NSG recipient mice. Unlike ILCP_NK cells, of which ~70% were PLZF-YFP+, only ~10% of ENKP_NK cells were PLZF-YFP+ (Fig. 3b), suggesting that ENKP_NK cells and ILCP_NK cells had different developmental pathways. ~25% of ALP-derived NK cells (ALP_NK cells) were PLZF-YFP+, similar to total NK cells (Fig 3a,b), thus ALP_NK cells were likely a mixture of ENKP-derived and ILCP-derived NK cells. In summary, these results indicated that ENKPs developed independently of ILCPs, and that there were at least two pathways for NK cell development.
Fig. 3. ENKPs develop independent of ILCPs.
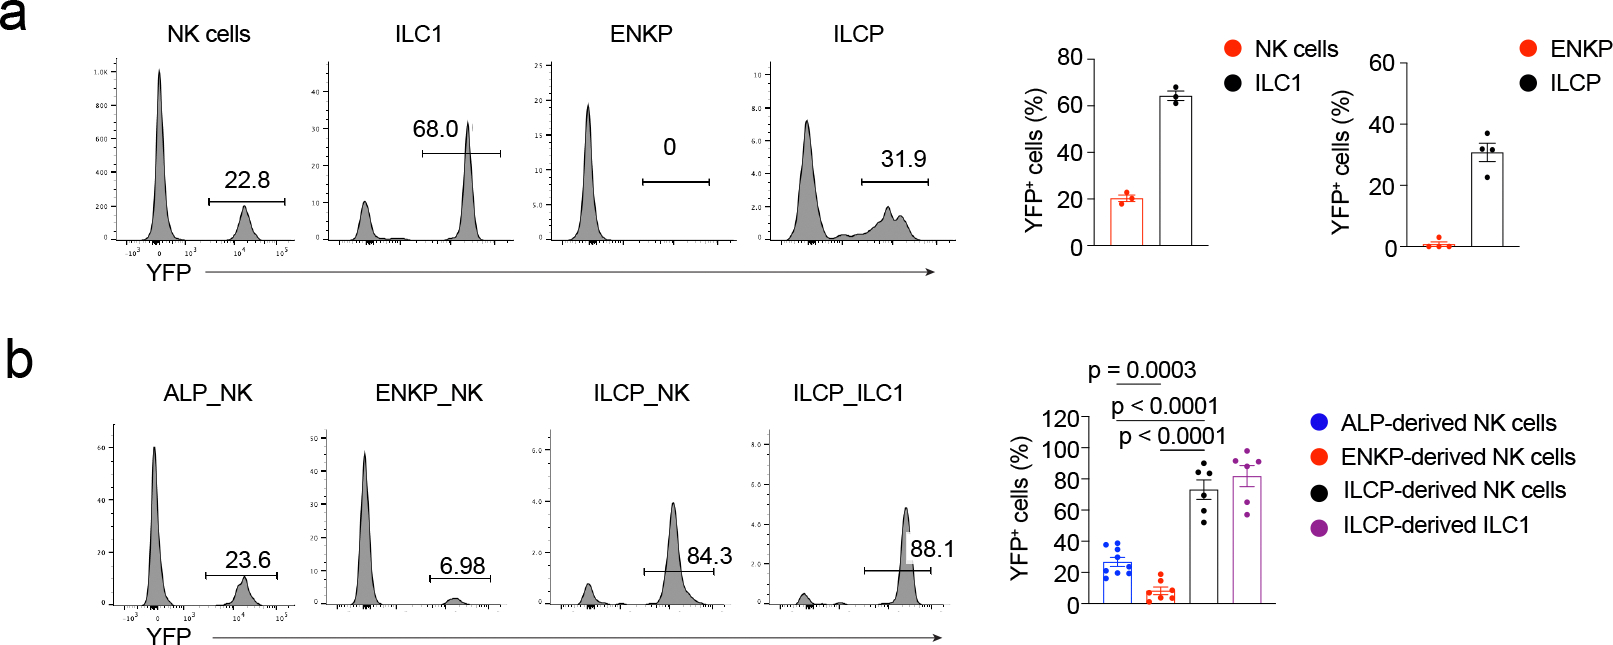
a, Representative histograms and quantification of PLZF-YFP+ ratio in group 1 ILCs (n = 3) in liver and in progenitors (n = 4) in BM combined from 2 independent experiments. b, Representative histograms and quantification of PLZF-YFP+ ratio of progenitor-derived NK cells in spleen and ILC1s in liver combined from 3 independent experiments. ALP-derived NK, n = 9; ENKP-derived NK, n = 7; ILCP-derived NK, n = 6; ILCP-derived ILC1, n = 6. Data are mean ± s.e.m. For b, statistical analysis used two-tailed unpaired Student’s t-test, without any adjustment for multiple comparisons.
ENKP_NK cells and ILCP_NK cells transcriptionally differ
We adoptively transferred CD45.2+ ENKPs, ILCPs or ALPs into NSG mice, sorted CD45.2+ NK cells from the spleen of recipient mice at 6 weeks post-transfer and performed multiplexed scRNA-seq for ENKP_NK cells, ILCP_NK cells and ALP_NK cells. ENKP_NK cells and ILCP_NK cells expressed comparable levels of Eomes, Tbx21 (encoding T-bet) and Klrk1 (encoding NKG2D) (Fig. 4b and Extended Data Fig. 4b). Genes expressed at higher levels in ENKP_NK cells than in ILCP_NK cells included Ly49 receptors (Klra8 and Klra4), cytotoxic genes (Gzma, Gzmb, and Prf1) and transcription factors (Zeb2, Irf8, and Klf2) (Fig. 4a,b and Extended Data Fig. 4a–c). ILCP_NK cells had higher expression of activating receptor Cd226, chemokine receptors Ccr2 and Cxcr3, and transcription factor Tcf7 (Fig. 4a,b and Extended Data Fig. 4a–c). ENKP_NK cells were enriched for cytotoxicity pathways (Extended Data Fig. 4d), whereas ILCP_NK cells were characterized by cell-cell adhesion and regulation of IFN-γ production (Extended Data Fig. 4d). Clustering of ALP_NK cells showed two major clusters with the ENKP_NK cluster more abundant than the ILCP_NK cluster (Extended Data Fig. 4e), suggesting ALP_NK cells were a mixture of ENKP_NK cells and ILCP_NK cells, with ENKP_NK cells being more abundant.
Fig. 4. ENKP and ILCP give rise to distinct NK cells.

a, Heatmap of average expression levels of representative genes differentially expressed in ENKP_NK and ILCP_NK from scRNA-seq. Each column is one developmental origin. Data are shown as z-score. b, Violin plots grouped by developmental origins show representative genes expressed similarly (upper) or differently (middle, higher in ENKP_NK; lower, higher in ILCP_NK) between ENKP_NK and ILCP_NK. c, Representative histograms, and quantification of Ly49H+ ratios in NK cells derived from ENKPs or ILCPs combined from 2 independent experiments. “Total NK” group is total NK cells from wild-type C57BL/6 mice. ENKP_NK, n = 5; ILCP_NK, n = 6; total NK, n = 4. d, Violin plots of human blood NK cells visualizing homologous genes identified to be upregulated in either mouse ENKP_NK or ILCP_NK cells, grouped according to the classification in Extended Data Fig. 6b. e, UMAP of human blood NK cells split by HCMV status analyzed by scRNA-seq. Annotation defined by surface protein expression measured by CITE-seq. f, Violin plots of gene set scores calculated in the human single cell blood NK data using the human homologues of the genes upregulated in either mouse ENKP_NK or ILCP_NK. Plots are split by HCMV status. For c, data are mean ± s.e.m. For d, data are integrated from Ref. 31, 32. For e, f, data are from Ref. 32.
UMAP of scRNA-seq of ENKP_NK cells, ILCP_NK cells and ALP_NK cells identified that each NK subset fell into 2 clusters, with ENKP_NK cells enriched in cluster_0 and ILCP_NK cells enriched in cluster_1 (Extended Data Fig 4f). Genes differentially expressed between cluster_0 and cluster_1 (such as Zeb2, Prf1, Klra8, Xcl1 and Cxcr3) were similar to genes differentially expressed between ENKP_NK cells and ILCP_NK cells (Extended Data Fig. 4a, g). Some genes such as Klra8 (encoding Ly49H) were differentially expressed between ENKP_NK cells and ILCP_NK cells in the same clusters (Extended Data Fig. 4h). Thus, ENKP_NK cells and ILCP_NK cells were transcriptionally different.
We used the scRNA-seq dataset of LinT−NK1.1+CD122+ group 1 ILCs from BM and published scRNA-seq dataset of liver group 1 ILCs from steady-state wild-type mice28 to compare the transcriptomes of ENKP_NK cells, ILCP_NK cells and ILC1s. Based on the expression levels of genes which were differentially expressed between ENKP_NK cells and ILCP_NK cells (see Methods) we first identified ENKP_NK cells and ILCP_NK cells within total NK cells in the BM and liver (Extended Data Fig. 4i). Then we compared the transcriptome of both NK subsets and ILC1s in the same tissues, as transcriptome can be influenced by tissue microenvironment29 and batch effects. In both liver and BM, ILCP_NK cells clustered together with ENKP_NK cells rather than with ILC1s (Extended Data Fig. 4i), indicating ILCP_NK cells were transcriptionally more similar to ENKP_NK cells than ILC1s. ILCP_NK cells expressed intermediate levels of genes differentially expressed between NK cells and ILC1s17 (see Methods)(Extended Data Fig. 4j), suggesting ILCP_NK cells may share some characteristics of both NK cells and ILC1s.
Ly49H recognizes the viral protein m157 present on cells infected by MCMV14. At 6 weeks after adoptive transfer of ENKPs or ILCPs into NSG mice, ILCP_NK cells were mostly Ly49H− whereas ~55% of ENKP_NK cells expressed Ly49H (Fig. 4c). In adoptive transfer experiments with ALPs as competitors, ENKPs gave rise to Ly49H+ NK cells more efficiently than ILCPs (Extended Data Fig. 5a), suggesting the majority of Ly49H+ NK cells developed from ENKPs. ENKPs were Ly49H− (Extended Data Fig. 5b), indicating Ly49H was upregulated downstream during NK cell development. Consistent with the scRNA-seq data, ~35% of ENKP_NK cells were Ly49D+ (encoded by Klra4) whereas ILCP_NK cells were Ly49D−, but comparable frequencies of ENKP_NK cells and ILCP_NK cells were Ly49E/F+ (encoded by Klra5/Klra6) (Extended Data Fig. 5c). ILCP_NK cells had higher frequencies (~80%) of TCF1-YFP+ (encoded by Tcf7YFP) than ENKP_NK cells (~40%) (Extended Data Fig. 5d–e).
The PLZF-YFP+/Ly49H+ ratio in NK cells in spleen, liver, lung, mesenteric lymph modes (mLN), thymus, salivary glands, uterus and BM of PLZF lineage-tracing chimeras indicated an inverse correlation between PLZF-YFP labeling and Ly49H expression (Extended Data Fig. 5f–i). PLZF-YFP+ ratios were lower in Ly49H+ NK cells compared to Ly49H− NK cells (Extended Data Fig. 5f). PLZF-YFP+ ratios in NK cells were lower in liver, spleen and lung (~18%) and higher in mLN (25%) and thymus (46%) (Extended Data Fig. 5f). PLZF-YFP+ ratios in NK cells in other tissues including salivary glands (6%), uterus (17%) and BM (20%) were also low (Extended Data Fig. 5h). Because ENKP_NK cells and ILCP_NK cells were marked at different ratios in NSG mice reconstituted with PLZF-YFP− ENKPs or PLZF-YFP− ILCPs (Fig. 3b), and assuming that only ENKP_NK cells and ILCP_NK cells contributed to the total NK cell population, we used the PLZF-YFP+ ratios in NK cell populations in PLZF lineage-tracing chimeras (Extended Data Fig. 5f,h) and calculated that more than 80% of NK cells in spleen, liver, lung, salivary glands, uterus and BM developed from ENKPs (see Methods).
Human NK cells have two major subsets, CD56dimCD16+ (CD56dim) and CD56brightCD16− (CD56bright) NK cells, with the CD56dim subset further subdivided into CD57− and CD57+ cells and the CD56bright NK cells more efficient in producing cytokines including IFN-γ30. To compare mouse and human NK cells, we analyzed published CITE-seq and scRNA-seq data31,32 of human blood NK cells. By surface protein expression we distinguished CD56bright, CD56dimCD57− and CD56dimCD57+ clusters (Extended Data Fig. 6a–b) present in both human cytomegalovirus (HCMV) seropositive and HCMV seronegative individuals, with an enrichment of CD56dimCD57+ NK cells in HCMV+ samples (Fig. 4e). CD56dimCD57− and CD56dimCD57+ NK cells had higher expression of genes upregulated in ENKP_NK cells, whereas CD56bright NK cells had higher expression of genes upregulated in ILCP_NK cells (Fig. 4d). NK cells expressing KIR2DL1, KIR2DL2 and KIR2DL3 expand in HCMV infection33, and KIR2DL1, KIR2DL2 and KIR2DL3 were expressed more highly in CD56dim NK cells than in CD56bright NK cells (Extended Data Fig. 6c)34. CD56dimCD57− and CD56dimCD57+ NK cells had higher ENKP_NK scores, whereas CD56bright NK cells had higher ILCP_NK scores (see Methods) in both the HCMV+ and HCMV− donors (Fig. 4f), suggesting HCMV status did not affect the transcriptional similarity between human and mouse NK subsets. We assessed the correlation between mouse and human NK clusters based on transcriptional similarity, and found mouse NK cluster_0, which was enriched in ENKP_NK cells, correlated more with human CD56dimCD57− and CD56dimCD57+ NK cells, whereas mouse NK cluster_1, which was enriched in ILCP_NK cells, correlated more with human CD56bright NK cells (Extended Data Fig. 6d). ENKP_NK cells correlated more with human CD56dimCD57− and CD56dimCD57 NK cells, whereas ILCP_NK cells correlated more with human CD56bright NK cells (Extended Data Fig. 6e). Thus, there is developmental heterogeneity in NK cells, that may be evolutionarily conserved between human and mouse.
ENKP_NK cells respond robustly to MCMV infection
We reconstituted NSG mice with equal numbers of ENKPs or ILCPs and intraperitoneally challenged them with MCMV 5 weeks post-transfer, then assessed NK cells in spleen and blood. At day 7 post-infection, the numbers of spleen ENKP_NK cells were approximately 150-fold higher than spleen ILCP_NK cells (Fig. 5c) whereas the numbers of spleen ENKP_NK cells were only 4-fold higher than spleen ILCP_NK cells without MCMV challenge (Fig. 5b). Over 99% of spleen ENKP_NK cells were Ly49H+ NK at day 7 post-MCMV infection, compared to ~20% of ILCP_NK cells (Fig. 5a). Ly49H+ ENKP_NK cells in blood were undetectable before infection but represented ~1.5% of total blood live cells at day 7 post-MCMV infection (Extended Data Fig. 7a–c). We further co-transferred ENKPs and ILCPs in the same NSG mice at a 1:4 ratio, based on the fact that ILCPs generated 4-fold fewer NK cells than ENKPs (Fig. 5b). Seven days post-MCMV infection, ENKP_NK cells represented ~90% of total spleen NK cells, compared to ILCP_NK cells which represented ~10% in the same environment (Extended Data Fig. 7d). In PLZF lineage-tracing chimeras, the ratio of PLZF-YFP+ spleen NK cells at steady-state (14.5%) decreased by day 7 post MCMV infection (8.6%)(Fig. 5d–e). Together, these observations indicated ENKP_NK cells expanded more robustly than ILCP_NK cells upon MCMV infection.
Fig. 5. ENKP-derived NK cells respond to MCMV infection.

a, c, Analysis of ENKP_NK cells and ILCP_NK cells from spleen on day 7 after MCMV infection. Representative flow plots (a), quantification of total cell numbers of ENKP_NK cells and ILCP_NK cells (c) combined from 2 independent experiments. 300 ENKPs or ILCPs were transferred into each NSG recipient mouse. n = 8. b, Quantification of total numbers of ENKP_NK cells and ILCP_NK cells from NSG mice without MCMV infection, n = 5. Total numbers were normalized to 300 ENKPs, ILCPs or mature NK cells. Combined data from 2 independent experiments. d, Quantification of PLZF-YFP+ ratio in total NK cells on day 7 after MCMV infection combined from 2 independent experiments. Not infected, n = 10; MCMV, n = 6. e, Quantification of total NK cells, PLZF-YFP+ and PLZF-YFP− NK subsets on day 7 after MCMV infection combined from 2 independent experiments. Uninfected, n = 10; MCMV, n = 6. For b - e, data are mean ± s.e.m, and statistical analysis used two-tailed unpaired Student’s t-tests, without any adjustment for multiple comparisons.
Surface markers identify ENKP_NK and ILCP_NK cells
Some transcripts encoding surface proteins were differentially expressed between ENKP_NK cells and ILCP_NK cells, and we verified protein expression of Ly49H, Ly49D, CD226, Thy1.2 and CXCR3 by flow cytometry (Fig. 4d, Extended Data Fig. 5c and 8a). We used combinations of these markers to identify an Ly49H+ and/or Ly49D+ ENKP_NK-enriched cell population (~10% PLZF-YFP+) and an Ly49H−Ly49D−CD226+Thy1.2+ or Ly49H−Ly49D−CD226+CXCR3+ ILCP_NK-enriched cell population (~50% PLZF-YFP+, similar to ~55% PLZF-YFP+ in ILC1s) (Fig. 6a–c). In TCF1-YFP mice, ENKP_NK-enriched cells had lower ratios of TCF1-YFP+ cells (~70%) than ILCP_NK-enriched cells (~95%) (Extended Data Fig. 8b). The PLZF-YFP+ ratios of Ly49H+ and/or Ly49D+, Ly49H−Ly49D−CD226+Thy1.2+ and Ly49H−Ly49D−CD226+CXCR3+ NK subsets remained unchanged at day 7 post-MCMV infection compared to steady-state (Extended Data Fig. 8c), indicating ENKP_NK cells and ILCP_NK cells did not substantially interconvert. The expansion of the ENKP_NK-enriched subset in chimeras and C57BL/6 mice at day 7 post-MCMV infection was similar to the population expansion of Ly49H+ NK cells in wild-type mice post-MCMV infection (Extended Data Fig. 8d–e)35. ENKP_NK-enriched and ILCP_NK-enriched cells, but not ILC1s, were greatly reduced in Eomes−/− mice (Extended Data Fig. 8f), but remained intact in Zbtb16−/− mice (Extended Data Fig. 8g), indicating the developmental divergence between ENKP_NK cells and ILCP_NK cells did not depend on PLZF.
Fig. 6. Characterization of functions of NK subsets.

a-c, Representative flow plots (a), histograms (b), and quantification of PLZF-YFP+ ratio (c) in spleen NK subsets from irradiated NSG mice transferred with PLZF-YFP−Lin−Kit+ progenitors. Spleen NK cells, n = 7 mice; spleen ILC1, n = 5 mice; liver ILC1, n = 11 mice. d, Quantification of NK cells and ILC1s in cecum lamina propria after Salmonella infection. Not infected, n = 9; Day 1, n = 9; Day 3, n = 10; Day 5, n = 7. e, Quantification of IFN-γ+ ratios and IFN-γ MFI in NK subsets and ILC1s after Salmonella infection. Day 1, n = 4; Day 3, n = 9; Day 5, n = 6. f, Quantification of NK cells in ear skin after HSV infection. Not infected, n = 8; Day 3, n = 9; Day 5, n = 9. g, Quantification of IFN-γ+ ratios and IFN-γ MFI in NK subsets and ILC1s after HSV infection. Day 3, n = 9; Day 5, n = 9. For c - g, n is number of mice. For c, combined from 3 independent experiments; for d - g, combined from 2 independent experiments. For d - g, ENKP_NK-enriched, Ly49H+ and/or Ly49D+; ILCP_NK-enriched, Ly49H−Ly49D−CD226+Thy1.2+. For d - g, data are mean ± s.e.m; for d, f, statistical analysis used two-tailed unpaired Student’s t-tests; for e, g, statistical analysis used two-tailed paired Student’s t-tests. No adjustments were made for multiple comparisons.
Although downregulation of CD27 and upregulation of CD11b and KLRG1 correlates with NK cell maturation36,37, ~30% of CD27+CD11b− NK cells remained CD11b− after adoptive transfer into unirradiated wild-type mice36. We found that CD27+CD11b− cells were enriched in ILCP_NK cells compared to ENKP_NK cells after adoptive transfer of ILCPs or ENKPs in NSG mice (Extended Data Fig. 9a), and the PLZF-YFP+ ratio in CD27+CD11b− NK cells (~25%) was higher than in CD27−CD11b+ NK cells (~16%) (Extended Data Fig. 9b). Similarly, ENKP_NK cells had higher expression of KLRG1 compared to ILCP_NK cells (Extended Data Fig. 9c) and the PLZF-YFP+ ratio in KLRG1−CD11b− “immature” NK cells (22%) was higher than in KLRG1+CD11b+ NK cells (18%) (Extended Data Fig. 9d), indicating that previously-defined immature NK cell subsets were likely a mixture of immature NK cells and mature ILCP_NK cells. Ly49H+CD27+CD62L− tissue-resident NK cells38 were phenotypically similar to ILCP_NK cells (Extended Data Fig. 9c), but the PLZF-YFP+ ratio in Ly49H+CD27+CD62L− NK cells was low (8%)(Extended Data Fig. 9e), indicating they are likely a subset of ENKP_NK cells.
We sorted ILCP_NK-enriched and ENKP_NK-enriched cells from spleen of C57BL/6 mice and stimulated them in vitro with PMA/Ionomycin for 3 hours to assess expression of IFN-γ, TNF and CD107a (Extended Data Fig. 10a). The ratios of IFN-γ+TNF−, IFN-γ+TNF+ and IFN-γ+TNF+ cells in ILCP_NK-enriched cells (20%, 3% and 2.5%, respectively) were higher than in ENKP_NK-enriched cells (10%, 0.5% and 0.5%, respectively) but the CD107a+ ratio was comparable between ILCP_NK-enriched cells and ENKP_NK-enriched cells (Extended Data Fig. 10a). ENKP_NK-enriched cells and ILCP_NK-enriched cells killed Yac-1 cells similarly (Extended Data Fig. 10b). In vitro differentiated ILCP_NK cells also had higher frequencies of cells expressing IFN-γ upon stimulation as compared to ENKP_NK cells (Extended Data Fig. 10c). These data indicated that ILCP_NK cells have better cytokine producing ability than ENKP_NK cells.
NK cells contribute to immunity against Salmonella infection39. We assessed cell number and expression of IFN-γ in ILCP_NK-enriched cell populations and ENKP_NK-enriched cell populations in the cecum lamina propria of C57BL/6 mice at day 1, 3 and 5 post-infection with Salmonella through oral gavage (Fig. 6d–e). Although both NK cell subsets increased in number after Salmonella infection (day 3, 18-fold for ENKP_NK-enriched, 13-fold for ILCP_NK-enriched; day 5, 5.7-fold for ENKP_NK-enriched, 3.5-fold for ILCP_NK-enriched) (Fig. 6d and Extended Data Fig. 10d), ILCP_NK-enriched cells had higher expression of IFN-γ than ENKP_NK-enriched cells (Fig. 6e and Extended Data Fig. 10e), while ILC1s did not expand and had significantly lower expression of IFN-γ than ILCP_NK-enriched cells (Fig. 6e and Extended Data Fig. 10e). NK cells also help control herpes simplex virus (HSV) infection40. We assessed cell numbers and IFN-γ expression in ILCP_NK-enriched and ENKP_NK-enriched cell populations in ear skin of C57BL/6 mice infected with HSV by intradermal injection. Both NK subsets expanded at day 3 and 7 post-infection compared to uninfected mice (day 3, 21-fold for ENKP_NK-enriched, 34-fold for ILCP_NK-enriched; day 7, 24-fold for ENKP_NK-enriched, 40-fold for ILCP_NK-enriched) (Fig. 6f and Extended Data Fig. 10f). A higher percentage of ILCP_NK-enriched cells (26% at day 3, 11% at day 7) were IFN-γ+ compared to ENKP_NK-enriched cells (18% at day 3, 7% at day 7)(Fig. 6g and Extended Data Fig. 10g). Although ILC1s expanded post-HSV infection (day 3, 3-fold; day 7, 11-fold), the expansion of ILCP_NK-enriched cells was more robust (Fig. 6f). Thus, we identified surface markers that distinguish ILCP_NK-enriched and ENKP_NK-enriched subsets in C57BL/6 mice, and ILCP_NK cells and ENKP_NK cells contributed to immune responses to infection, but with more robust cytokine production by ILCP_NK-enriched cells.
Discussion
Here, we established the existence of two separate pathways of NK cell development in mice. We identified ENKPs as an early NK progenitor that was the primary source of Ly49H+ NK cells that expanded upon MCMV infection. In contrast, ILCP_NK cells had low expression of Ly49H and did not respond robustly to MCMV infection, but expressed more IFN-γ upon infection with Salmonella or HSV.
Mouse ENKP_NK cells and ILCP_NK cells were transcriptionally and functionally similar to human CD56dim and CD56bright NK cells, respectively. Mouse Ly49H+ NK cells possess adaptive immune features during MCMV infection13,41. Similarly, human CD56dimNKG2C+ NK cells expand robustly in HCMV-seropositive individuals42. These similarities suggest that conserved developmental pathways may underlie the functional heterogeneity in both species. In support of this possibility, a recent study confirmed that the transcriptional signatures described here for NK subsets were also evident in their human NK subsets [in press]. Consistently, human CD56bright NK cells produced more IFN-γ in response to cytokines43. However, human CD56bright NK cells produced less IFN-γ in response to target cells or engagement of activating receptors compared to CD56dim NK cells44, indicating the differences in IFN-γ expression between mouse ILCP_NK cells and ENKP_NK cells may also be context-dependent.
Whether human CD56bright NK cells are precursors of CD56dim NK cells, or whether these populations also reflect developmental heterogeneity remains unknown45. Barcoding-based lineage-tracing revealed that CD56−CD16+ and CD56+CD16− NK cells in non-human primates are developmentally different46, indicating different development pathways of NK cells may exist in multiple vertebrate species. Similar barcoding approaches can provide additional insight into the developmental pathways that generate NK cells in mice.
Our study implicates different developmental pathways as underlying functional heterogeneity of NK cells and identifies precursors for conventional NK cells expressing Ly49H in mice. We speculate ILCP_NK cells evolved initially, and viruses, and perhaps specifically CMV drove the selection of a separate population of NK cells with adaptive features. Thus, although the activating receptors for response to CMV are different in humans and mice14,42, the developmental pathways that generate NK cell subsets specialized for the same threat may be conserved. If these developmental pathways were present in the common ancestor of humans and mice, which seems likely, we predict they are present in many related vertebrate species.
Methods
Mice
Tcf7YFP, Tcf7GFP, Zbtb16GFPcre, Tcf7−/−, Nfil3−/−, Il7rcre, Gata3flox, Eomesflox, EomesGFP mice were described previously2,3,16,23,24,47,48,49,50. B6-Ly5.2 (CD45.1) and B6.129X1-Gt(ROSA)26Sortm1(EYFP)Cos/J (strain #: 006148) mice were obtained from Jackson Laboratory. NOD-scid IL2Rgammanull (NSG) mice were obtained from National Cancer Institute. All mice except NSG mice are maintained on C57BL/6 background. Mice were 6–18 weeks of age and of either sex. Animal procedures were approved by relevant National Institutes of Health Animal Care and Use Committees.
Antibodies and flow cytometry
BM, spleen and liver samples were incubated with a mix of purified rat, mouse and hamster immunoglobulin G (IgG) before the addition of specific antibodies, and then stained and analyzed in FACS buffer (PBS containing 2 mM EDTA and 0.5% FBS). The following anti-mouse antibodies were used for immunostaining: 2B4 (eBio244F4, PE-Cy7, Thermo Fisher Scientific, 25-2441-82), α4β7 (DATK32, BV711, BD biosciences, 740701; DATK32, PerCP-Cy5.5, Thermo Fisher Scientific, 46-5887-82), B220 (RA3-6B2, biotin, Thermo Fisher Scientific, 13-0452-86), CD11c (N418, biotin, Thermo Fisher Scientific, 13-0114-85), CD122 (TM-b1, PE, Thermo Fisher Scientific, 12-1222-82), CD19 (eBio1D3, biotin, Thermo Fisher Scientific, 13-0193-85; 6D5, BV605, BioLegend, 115540), CD200R (OX110, APC, Thermo Fisher Scientific, 17-5201-82), CD25 (BC96, PE, Thermo Fisher Scientific, 12-0259-80), CD27 (LG.7F9, PerCP-Cy5.5, Thermo Fisher Scientific, 46-0271-82), CD3 (17A2, AF700, Thermo Fisher Scientific, 56-0032-82), CD3e (eBio500A2, biotin, Thermo Fisher Scientific, 13-0033-86; 145-2C11, BV510, BioLegend, 100353; 145-2C11, SB600, Thermo Fisher Scientific, 63-0031-82), CD4 (GK1.5, biotin, Thermo Fisher Scientific, 13-0041-82; RM4-5, SB600, Thermo Fisher Scientific, 63-0042-82), CD45.1 (A20, eF450, Thermo Fisher Scientific, 48-0453-82; A20, PE-eF610, Thermo Fisher Scientific, 61-0453-82), CD45.2 (104, eF450, Thermo Fisher Scientific, 48-0454-82; 104, PerCP-Cy5.5, BioLegend, 109828), CD49a (HMα1, APC, BioLegend, 142606), CD49b (DX5, AF700, Thermo Fisher Scientific, 56-5971-82; DX5, APC-Cy7, Thermo Fisher Scientific, 47-5971-82; DX5, PE-eF610, Thermo Fisher Scientific, 61-5971-82), CD5 (53-7.3, BV605, BD biosciences, 563194), CD8α (53-6.7, biotin, Thermo Fisher Scientific, 13-0081-85; 53-6.7, SB600, Thermo Fisher Scientific, 63-0081-82), CD8β (CT-CD8b, biotin, Thermo Fisher Scientific, MA5-17845; eBioH35-17.2, SB600, Thermo Fisher Scientific, 63-0083-82), Flt3 (A2F10.1, PE-CF594, BD biosciences, 562537), Gr-1 (RB6-8C5, biotin, Thermo Fisher Scientific, 13-5931-86), ICOS (7E.17G9, PE, Thermo Fisher Scientific, 12-9942-82), IL-7Rα (A7R34, APC, Thermo Fisher Scientific, 17-1271-82), Kit (2B8, BV785, BioLegend, 105841; 2B8, PE-Cy7, Thermo Fisher Scientific, 25-1171-82), Ly49H (3D10, PE, BioLegend, 144706; 3D10, FITC, Thermo Fisher Scientific, 11-5886-82), Ly49D (4E5, BV 711, BD biosciences, 742559), Mac-1 (M1/70, biotin, Thermo Fisher Scientific, 13-0112-86), NK1.1 (PK136, APC-Cy7, Thermo Fisher Scientific, 47-5941-82; PK136, biotin, Thermo Fisher Scientific, 13-5941-85; PK136, BV785, BioLegend, 108749), NKp46 (29A1.4, PE-Cy7, Thermo Fisher Scientific, 25-3351-82), streptavidin (eF450, Thermo Fisher Scientific, 48-4317-82; APC-Cy7, Thermo Fisher Scientific, 47-4317-82), Sca1 (D7, AF700, Thermo Fisher Scientific, 56-5981-82), TCRβ (H57-597, biotin, Thermo Fisher Scientific, 13-5961-85; H57-597, SB600, Thermo Fisher Scientific, 63-5961-82), TCRγδ (eBioGL3, biotin, Thermo Fisher Scientific, 13-5711-85; eBioGL3, SB600, Thermo Fisher Scientific, 63-5711-82), Ter119 (TER-119, biotin, Thermo Fisher Scientific, 13-5921-85), Thy1.2 (53-2.1, AF700, BioLegend, 140324; 53-2.1, BV605, BioLegend, 140318), CD226 (TX42.1, BV650, BioLegend, 133621), CXCR3 (CXCR3-173, APC, Thermo Fisher Scientific, 17-1831-82). The lineage ‘cocktail’ (Lin) is a mix of the following biotin antibodies: anti-Gr-1, NK1.1, CD19, Ter119, CD11c, CD3, CD4, CD8α, CD8β, TCRβ, TCRγδ, Ly-6D, B220, Mac-1. T lineage ‘cocktail’ (LinT) contains anti-CD3, CD4, CD8α, CD8β, TCRβ, TCRγδ. Non-T/NK lineage ‘cocktail’ contains anti-Gr-1, CD19, Ter119, CD11c, Ly-6D, B220.
BM progenitor definition and isolation
BM progenitors were defined and isolated by flow cytometric sort as follows. ALPs (Lin−Kit+α4β7−Tcf7−Flt3+IL-7Rα+), ILCPs (Lin−Kit+α4β7+Tcf7YFP+Flt3−Thy1.2+ or Lin−Kit+α4β7+PD-1+Flt3−Thy1.2+) and ENKPs (Lin−CD27+2B4+Flt3+CD122+) were isolated from Tcf7YFP mice. For PLZF lineage-tracing (Fig 3b), ILCPs were sorted as Lin−Kit+α4β7+Tcf7GFP+Flt3−Thy1.2+. Before sorting of BM progenitors, bone marrow samples were stained with biotin lineage ‘cocktail’ (Lin), and then depleted by streptavidin beads (Biolegend, 480016) according to the manufacturer’s instructions.
Cell culture
BM progenitors were sorted by flow cytometric cell sorting. BM progenitors were cultured on irradiated OP9 stromal cells in α-MEM supplemented with 20% fetal bovine serum, penicillin and streptomycin. Bulk cultures were supplemented with 30 ng/ml SCF, 30 ng/ml IL-7, 30 ng/ml Flt3L and 30 ng/ml IL-2, and progenitor differentiation was examined at 7d after seeding. Single cell cultures were supplemented with 30 ng/ml SCF, 30 ng/ml IL-7, 30 ng/ml Flt3L and 10 ng/ml IL-2, and progenitor differentiation was examined at 10d after seeding. For single cell assay, positive well was defined as > 10 total ILCs, and positive lineage was defined as frequency > 10% and number > = 3. For in vitro stimulation, NK cells sorted from bulk culture were incubated with IL-12 (20 ng/ml), IL-18 (10 ng/ml) or PMA (50 ng/ml), Ionomycin (500 ng/ml) for 1 hr, then Brefeldin A was added to a final concentration of 5 ug/ml for another 2 hrs’ incubation. Cytokines were purchased from PeproTech.
Adoptive transfer
For ENKP and ILCP transfer, around 200–500 progenitors (CD45.2) were injected into NSG recipient mice (CD45.1) if not mentioned specifically. For competitive assay, around 300–500 test progenitors (CD45.2) were mixed with same numbers of competitor progenitors (CD45.1) and injected into NSG recipient mice (CD45.1). Reconstitution of lymphocytes was examined at 6-weeks post-transfer. For PLZF lineage-tracing chimeras, 3X10⁵ YFP− LK (Lin−Kit+) progenitors (CD45.2) obtained by cell sorting were injected into lethally irradiated (850 rads) B6-Ly5.2 recipient mice (CD45.1), or injected into sublethally irradiated (250 rads) NSG mice. Reconstitution of lymphocytes and progenitors was examined at 12–16 weeks post-transfer.
Calculation of ENKP_NK cell and ILCP_NK cell contributions to total NK population
To calculate contribution percentage of ENKP_NK cells and ILCP_NK cells, the following equation set was used: 10%*X + 70%*Y = a%; X + Y = 100%. 10% was the observed PLZF tracing ratio of ENKP_NK cells, 70% was the observed PLZF tracing ratio of ILCP_NK cells, a% was the observed PLZF tracing ratio of total NK cells in different tissues (for example, in liver a% was 18%, Extended Fig. 5h), X was the calculated percentage of ENKP_NK cells and Y was the calculated percentage of ILCP_NK cells.
scRNA-seq and analysis for mouse samples
Cells from BM were isolated by sorting from Tcf7YFP mice (Fig. 1). NK cells from spleen were sorted from NSG mice adoptively transferred with ALPs, ENKPs or ILCPs (Fig 4). scRNA-seq libraries were prepared using 10X Genomics Single Cell 3’ Reagent Kits v3.1, according to the manufacturer’s instructions. The obtained libraries were sequenced with a NextSeq system. Base calling was performed using RTA 3.9.2 (BM samples) or RTA 3.9.25 (spleen sample), and alignment was performed using cellranger v6.1.1 (STAR 2.7.2a). For spleen sample, hashtaging antibodies used for the analysis were mHTO01, mHTO02, and mHTO03 TotalSeqA bought from BioLegend, and demultiplexing was performed using cellranger v6.1.1 (Bcl2fastq 2.20.0). Cells with low UMI counts were determined by the 10x Genomics Cell Ranger Algorithm. Single-cell analysis was performed using Seurat (version 4.1.0). Cells with >6% mitochondrial gene content and >8000 genes (BM samples) or >4000 genes (spleen sample) were excluded from analysis. Mitochondrial content and cell-cycle related genes were regressed out. T cell contaminants were removed from BM samples. Cells were analyzed mainly by Seurat’s functions51. Cells were clustered using Seurat’s “FindClusters” function. Pseudotime analysis was performed using “Slingshot” package (version 2.2.1)52. Differentially expressed genes (DEGs) were identified using Seurat’s “FindMarkers” function considering those genes expressed in at least 10% of cells in the clusters with a minimum log2 fold change threshold of 0.25. Violin plots were made using Seurat’s normalized data. Average gene expression from cells of the same developmental origin was generated using the Seurat’s “AverageExpression” function. Gene ontology pathway analysis of DEGs was carried out with the “enrichGO” function. Volcano plots were generated using “ggplot2” package (version 3.4.0).
To compare transcriptomes of mouse NK subsets and ILC1s, liver ILC1 and NK cell data were downloaded from the gene expression omnibus (GSE16345228) and loaded into Seurat. In addition, in house generated BM derived NK and ILC1 scRNAseq (see Figure 1a) was loaded into Seurat. For published liver data, the hashtags used to label the publicly available data were demultiplexed using the HTODemux function, following CLR normalization. Cells from Hobit-KO mice were discarded, and cells were flagged as low quality and removed if they had <= 1000 or >= 8000 reads, and > 6% mitochondrial reads. All datasets were processed according to a standard Seurat pipeline. The FindNeighbors and FindClusters functions were used to cluster the cells and identify NK cells or ILC1s. Gene set scores were calculated using ENKP_NK gene list (Zeb2, Irf8, Klf2, Gzmb, Gzma, Prf1, Itgam, Ccl5, Klra3, Klra4, Klra7, Klra8, Klra9) and ILCP_NK gene list (Tcf7, Cd160, Cd226, Cd7, Cd27, Ccr2, Cxcr3, Xcl1, Ltb, Ifng, Cd69). These scores were fed into the kmeans function, allowing cells to be clustered using these gene scores. This resulted in the identification of 2 NK cell clusters, allowing them to be annotated as ENKP_NK or ILCP_NK. For each population of NK cells and ILC1s the average gene expression was calculated using the AverageExpression function, and Euclidean distance was calculated using the dist function. The averaged data was used to examine expression of genes previously determined to be differentially expressed between NK cells and ILC1s17 that also were significantly different between NK cells and ILC1s in both liver and BM, with a fold change >= 0.25 and FDR of <= 0.05.
scRNA-seq analysis of human NK cell
The human NK scRNAseq data was obtained from GSE13043031 and GSE19703732 was analysed using a standard Seurat analysis. Batch correction was performed using the RunHarmony function from the “harmony” package to correct batch effects. The CITEseq data was normalized by applying a centered log ratio normalization. Clusters identified using the RNA modality were annotated based on the protein expression of CD56 and CD57. The annotation was extended using the glmnet and cv.glmnet function to all datasets. Cross species comparisons were done by identifying homologs between mouse and human using the homologene package; and by turning mouse genes to uppercase. Differentially expressed gene (DEG)s were identified by applying the “FindMarkers” function from Seurat within the populations or samples of one species. The DEG shared between species were retained and for each population or sample the counts of individual cells were summed using the “AggregateExpression” function and log transformed, generating pseudobulk data. The genes of the pseudobulk data were centered by dividing by their average gene expression. Spearman correlation was done on these matrices using the “cor” function, allowing correlation of the populations between different species. Scores were calculated by averageing the expression of gene sets identified in the mouse scRNA-seq data (ENKP_NK score: ZEB2, IRF8, KLF2, GZMB, GZMA, PRF1, ITGAM and CCL5; ILCP_NK score: TCF7, CD160, CD226, CD7, CCR2, CXCR3, XCL1, LTB, IFNG and CD69) and substracting their average by the average gene expression of 100 randomly sampled genes. Plots were generated using either the “Seurat” or “ggplot2” packages.
MCMV infection
MCMV (Smith strain) was prepared as described previously53 and virus titer was 2200 PFU/ml. MCMV stock was 1:400 diluted in 1XPBS and 200 μl of MCMV diluent was intraperitoneally injected into each mouse. Blood and spleen samples were analyzed by flow cytometry 7 days after infection.
Salmonella infection and cecal immune cell isolation
Salmonella Typhimurium strain IR715, a nalidixic acid resistant strain, was used for all experiments. Bacteria was cultured in Luria broth (LB) at 37°C shaking for 18 hours. Cells were washed in PBS and adjusted to final concentration of 5×10⁸ CFU/mL in PBS. C57BL6 mice, 8–10-week-old, were gavaged with 20mg streptomycin, and fasted overnight. 24 hours later mice were gavaged with 108 CFU S. Typhimurium in 200 uL PBS. Infection was confirmed by measuring CFU at 24 hours by homogenizing fecal pellets in PBS and plating on LB agar with 50μg/mL nalidixic acid. Cecal contents was also plated at takedown to quantify S. Typhimurium CFU. Mice were sacrificed at 1, 3 or 5 days post-infection to analyze gut immune cells in the cecum. Immune cells from the cecum of S. Typhimurium infected mice were isolated as previously described with some modifications54. Briefly, ceca were extracted and contents removed into sterile PBS for CFU quantification. Ceca were then cut open longitudinally, washed and incubated in complete medium (RPMI 1640 plus 3% fetal bovine serum, 1 mM pyruvate, 0.1 mM nonessential amino acids, 2 mM glutamine, 20 mM HEPES, 100 U/ml penicillin, 0.1 mg/ml streptomycin, and 50 μM β-mercaptoethanol) with 5mM EDTA and 1mM dithiothreitol for 15 minutes at 37°C stirring. Ceca were shaken 3 times in 10mL RPMI + 2mM EDTA to remove epithelial cells, then cut into small pieces for digestion in RPMI media containing 0.5 mg/ml Collagenase Type 4 (Worthington Biochemical), 8% FBS and 50 mM CaCl2. After a 30-minute digestion at room temperature with stirring, cells were passed through a 70μm filter and washed with 10mL complete media. Finally, cells were pelleted, resuspended in 37.5% Percoll, spun at 600g for 5 minutes, and cell pellets were resuspended in complete media for flow cytometry analysis.
Herpes simplex virus-1 (HSV-1) infection and ear digestion
Female mice were injected intradermally with 15uL of HSV-1 (1×10⁶ PFU in sterile tissue-culture-grade PBS) in the ear pinnae using a 29G needle. Control mice were injected with same amount of sterile tissue-culture-grade PBS. Immune responses were analyzed at day 3 or 7 post-infection. At day 3 or 7 post-infection, mice were euthanized and ears were cut and the ventral and dorsal sheets of ears were separated and digested in the media with DNase and Liberase (RPMI 1640 media with 2 mM L-glutamine, 1 mM sodium pyruvate and nonessential amino acids, 55 mM β-mercaptoethanol, 20 mM HEPES, 100 U/ml penicillin, 100 mg/ml streptomycin, 0.5 mg/ml DNase and 0.025 mg/ml Liberase TL purified enzyme blend) at 37°C for 1 hour and 45min. Digested ears were homogenized and filtered through 70-μm cell strainer.
In vitro cytotoxicity assay
Freshly sorted spleen NK cells were co-cultured with Yac-1 mouse lymphoma cells at 4:1, 2:1 and 1:1 ratios in IMDM media (supplemented with 20% fetal bovine serum, nonessential amino acids, L-glutamine, 2-mercaptoethanol, penicillin and streptomycin) for 4 hours. Yac-1 cells were traced by CFSE to distinguish from NK cells. Specific lysis was calculated by the formula: (a − b) / a × 100%; a is the number of Yac-1 cells without NK cell co-culture; b is the number of Yac-1 cells with NK cell co-culture.
Statistical analysis & Reproducibility
Statistical significance was performed with GraphPad Prism. Differences between groups were determined by a two-tailed unpaired or paired Student’s t test and were considered to be statistically significant when P values were less than 0.05. No statistical method was used to predetermine sample size. No data were excluded from the analyses. Animal/samples were randomly assigned to the various experimental groups. The Investigators were not blinded to allocation during experiments and outcome assessment. Data collection and analysis were not performed blind to the conditions of the experiments. No statistical methods were used to pre-determine sample sizes but our sample sizes are similar to those reported in previous publications2,16. Data distribution was assumed to be normal but this was not formally tested.
Extended Data
Extended Data Fig. 1. Characterization of early NK cell development in bone marrow.

a, Gating strategy for sorting ALP, EILP, ILCP, ILC2P, CD122+ progenitor, NK cell and ILC1 from bone marrow for scRNA-seq. b, UMAP of scRNA-seq samples grouped by original idents. c, Feature plots of genes critical for identifying UMAP clusters. d, Violin plots of ENKP and NK cluster. e, Slingshot pseudotime and heatmap of gene expression ordered by pseudotime.
Extended Data Fig. 2. Characterization of ENKPs.

a, Representative flow plots of ENKPs and quantification of ENKPs and NK cells in bone marrow of Tcf7-deficient mice (n = 3) and control mice (n = 5). Combined data from 2 independent experiments. b, Representative flow plots of ENKPs and quantification of ENKPs and NK cells in bone marrow of Gata3-deficient mice, n = 5. Combined data from 2 independent experiments. c, Representative histograms of surface marker expression by different progenitors from 2 independent experiments. d, Quantifications of Il7r-lineage tracing ratios in ENKPs and NK cells in bone marrow, n = 5. Representative data from 3 independent experiments. For a, b and d, data are mean ± s.e.m. For a and b, statistical analysis was performed using two-tailed unpaired Student’s t-tests.
Extended Data Fig. 3. Assessment of lineage potential of ENKPs.

a, Representative flow plots of in vitro cultured NK cells (CD3−CD19−NKp46+NK1.1+CD49a−DX5+EomesGFP+) and ILC1s (CD3−CD19−NKp46+NK1.1+CD49a+DX5− EomesGFP−) sorted from spleen and liver of EomesGFP mice from 2 independent experiments. b, Representative flow plots of in vitro clonal assay. c, Quantification of in vitro differentiated NK cells, comparing progenitors and mature NK cells, n = 4. NK cells were defined as NK1.1+EomesGFP+CD220R−. Representative data from 2 independent experiments. d, Quantification of in vitro differentiated NK cells, comparing with and without Flt3L, n = 4. NK cells were defined as NK1.1+EomesGFP+CD220R−. Representative data from 2 independent experiments. e, Quantification of NK cell chimerism after competitive assay in liver combined from 2 independent experiments (same strategy as in Fig. 2e). ALP group, n = 5; ENKP group, n = 5; ILCP group, n = 4. f - h, Representative flow plots of post-sort purity check for ENKP (f), ILCP (g) and ALP (h). i, Quantification of total spleen NK cells and ILC1s derived from control or Eomes-deficient progenitors combined from 2 independent experiments. ENKP-derived NK, n = 5; ILCP-derived NK and ILC1, n = 9. For c, d, e, i, data are mean ± s.e.m., and statistical analysis was performed using two-tailed unpaired Student’s t-tests.
Extended Data Fig. 4. ENKP_NK and ILCP_NK are transcriptionally different.
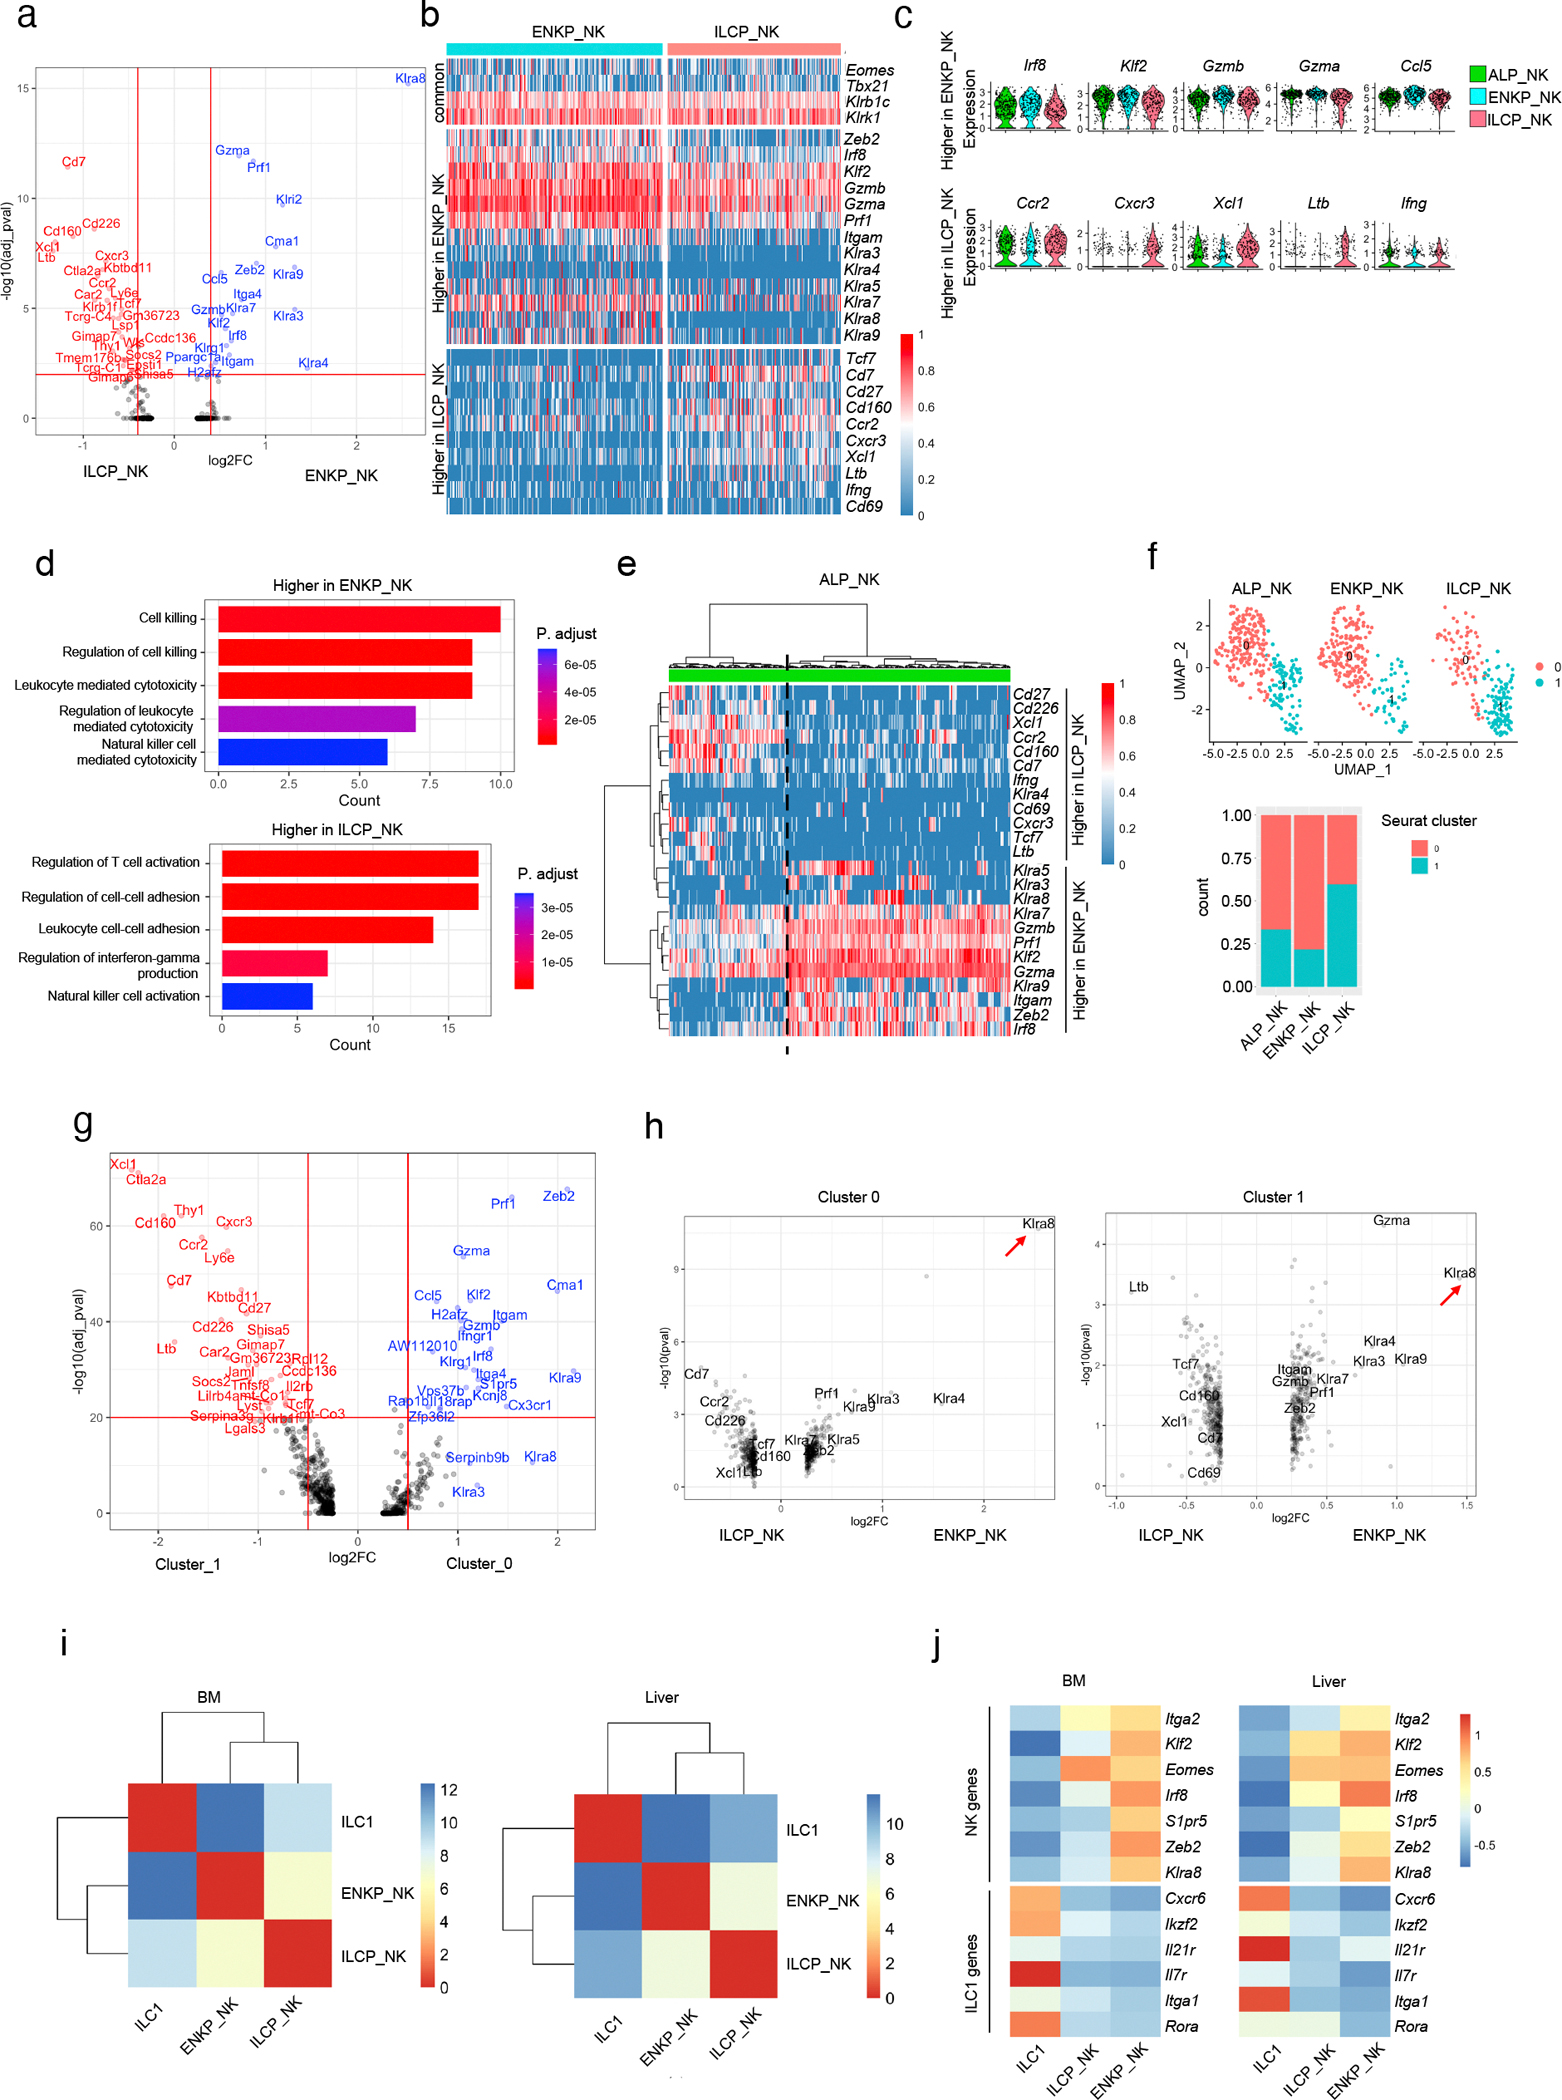
a, Volcano plot of differentially expressed genes between ENKP_NK cells and ILCP_NK cells. b, Heatmap of genes equally expressed (upper) and differentially expressed between ENKP_NK and ILCP_NK (middle and lower). Each column represents one cell. c, Violin plots of genes expressed higher in ENKP_NK (upper) and higher in ILCP_NK (lower) grouped by developmental origins. d, GO enrichment analysis using genes expressed higher in ENKP_NK cells (upper) or ILCP_NK cells (lower). e, Hierarchically clustered heatmap of gene expression levels of genes differentially expressed between ENKP_NK cells and ILCP_NK cells in ALP_NK cells. Each column represents one cell. Dashed line indicates separation between two major column clusters. f, UMAP and bar plot of scRNA-seq of progenitor-derived NK cells grouped by developmental origins. g, Volcano plot of differentially expressed genes between cluster 0 and cluster 1. h, Volcano plot of differentially expressed genes between ENKP_NK and ILCP_NK in cluster 0 (left) and in cluster 1 (right). Arrow highlights the gene “Klra8”. i, Hierarchically clustered Euclidean distance matrix of transcriptomes of NK cells and ILC1s in bone marrow (left) and liver (right). j, Heatmap of select genes (see Methods) differentially expressed between NK cells and ILC1s in ENKP_NK cells, ILCP_NK cells and ILC1s in bone marrow (left) and liver (right). For i, j, bone marrow data is from scRNA-seq in Fig. 1a, liver data is from dataset of Friedrich et al., 2021.
Extended Data Fig. 5. ENKPs and ILCPs give rise to distinct NK cells.

a, Quantification of chimerism in competitive assay (same strategy as in Fig. 2e) from 2 independent experiments. ALP group, n = 8; ENKP group, n = 9; ILCP group, n = 8. b, Representative flow plots and quantification of Ly49H+ ratios in ENKPs and NK cells in bone marrow combined from 2 independent experiments, n = 5. c, Quantification of Ly49 receptor positive ratios in ENKP_NK cells and ILCP_NK cells from NSG mice transferred with ENKPs or ILCPs, n = 10, combined from 2 independent experiments. d, Representative histogram of TCF1-YFP expression and quantification of TCF1-YFP+ ratios in ENKP_NK cells and ILCP_NK cells from NSG mice transferred with ENKPs or ILCPs, n = 10, combined from 2 independent experiments. e, Violin plots of Tcf7 from scRNA-seq grouped by developmental origins. f, Quantification of PLZF lineage tracing ratios in different tissues from irradiated wild-type mice transferred with Lin−Kit+ progenitors (PLZF-tracing long-term chimera), n = 7, combined from 2 independent experiments. B cells were used as negative control for PLZF labeling. g, Quantification of Ly49H+ ratios in NK cells in different tissues from PLZF-tracing long-term chimeras, n = 7 combined from 2 independent experiments. h - i, Quantification of PLZF lineage tracing ratios (h) and Ly49H+ ratios in NK cells (i) in different tissues from irradiated NSG mice transferred with Lin−Kit+ progenitors (NSG PLZF-tracing long-term chimera) combined from 3 independent experiments. spleen and salivary glands (SG), n = 7; uterus and bone marrow (BM), n = 6. For a-d, f - i, data are mean ± s.e.m. For a,c,d, f - i, statistical analysis was performed using two-tailed unpaired Student’s t-tests.
Extended Data Fig. 6. ENKP-derived and ILCP-derived NK cells are similar to human CD56 dim and CD56 bright NK cells, respectively.

a. Feature plots of surface protein expression in human blood NK measured by CITE-seq. b. UMAP of human blood NK cells analyzed by scRNA-seq. Annotation defined by surface protein expression measured by CITE-seq. c. Feature plots of KIR genes in human blood NK cells analyzed by scRNA-seq. d. Heatmap of Spearman correlation analysis between mouse NK clusters and human NK clusters. e. Heatmap of Spearman correlation analysis between mouse NK developmental originals and human NK clusters. For a - e, data were integrated from datasets of Rückert et al., 2022 and Yang et al., 2019.
Extended Data Fig. 7. ENKP-derived NK cells respond to MCMV infection.

a-b, Analysis of ENKP_NK cells and ILCP_NK cells in peripheral blood on day 7 after MCMV infection. Representative flow plots (a) and quantification of frequencies (c) of ENKP_NK cells and ILCP_NK cells, n = 8 combined from 2 independent experiments. b, Quantification of frequencies of ENKP_NK and ILCP_NK cells in blood without MCMV infection, n = 5, combined from 2 independent experiments. For b and c, 300 ENKPs or ILCPs were transferred into each NSG mice. d, Quantification of ratios of ENKP and ILCP-derived NK cells from NSG mice co-transferred with ENKPs and ILCPs using different congenic markers (CD45.1 vs CD45.2), day 7 after MCMV infection combined from 2 independent experiments. n = 9. For b - d, data are mean ± s.e.m.
Extended Data Fig. 8. Verification of ENKP_NK and ILCP_NK-enriched cell population.

a, Representative histograms and quantification of frequencies of cells expressing specific surface markers in spleen NK cells derived from ENKPs or ILCPs combined from 2 independent experiments. n = 10. b, Representative histograms and quantification of frequencies of cells expressing TCF1-YFP in spleen NK subsets from TCF1-YFP reporter mice combined from 2 independent experiments. n = 5. c - d, Quantification of PLZF-tracing ratios (c) and NK cell numbers (d) in spleen NK subsets from NSG PLZF-tracing long-term chimera day 7 after MCMV infection combined from 2 independent experiments. Not infected, n = 10; MCMV, n = 5. e, Quantification of NK cell numbers in spleen NK subsets in wild-type B6 mice on day 7 after MCMV infection combined from 2 independent experiments. n = 5. f, Quantification of cell number in spleen of total NK cells, NK subsets and ILC1s in Eomes-deficient mice combined from 2 independent experiments. IL-7RACreEomes+/+, n = 5; IL-7RACreEomesfl/fl;, n = 6. g, Quantification of cell number in spleen of total NK cells and NK subsets in Zbtb16-deficient mice combined from 2 independent experiments. Zbtb16+/+, n = 5; Zbtb16GFPcre/GFPcre, n = 6. h, Quantification of cell numbers of spleen NKT cells in Zbtb16-deficient mice combined from 2 independent experiments. n = 3. For a - h, data are mean ± s.e.m., and statistical analysis was performed using two-tailed unpaired Student’s t-tests.
Extended Data Fig. 9. Distinguish ENKP_NK cells and ILCP_NK cells by surface markers.
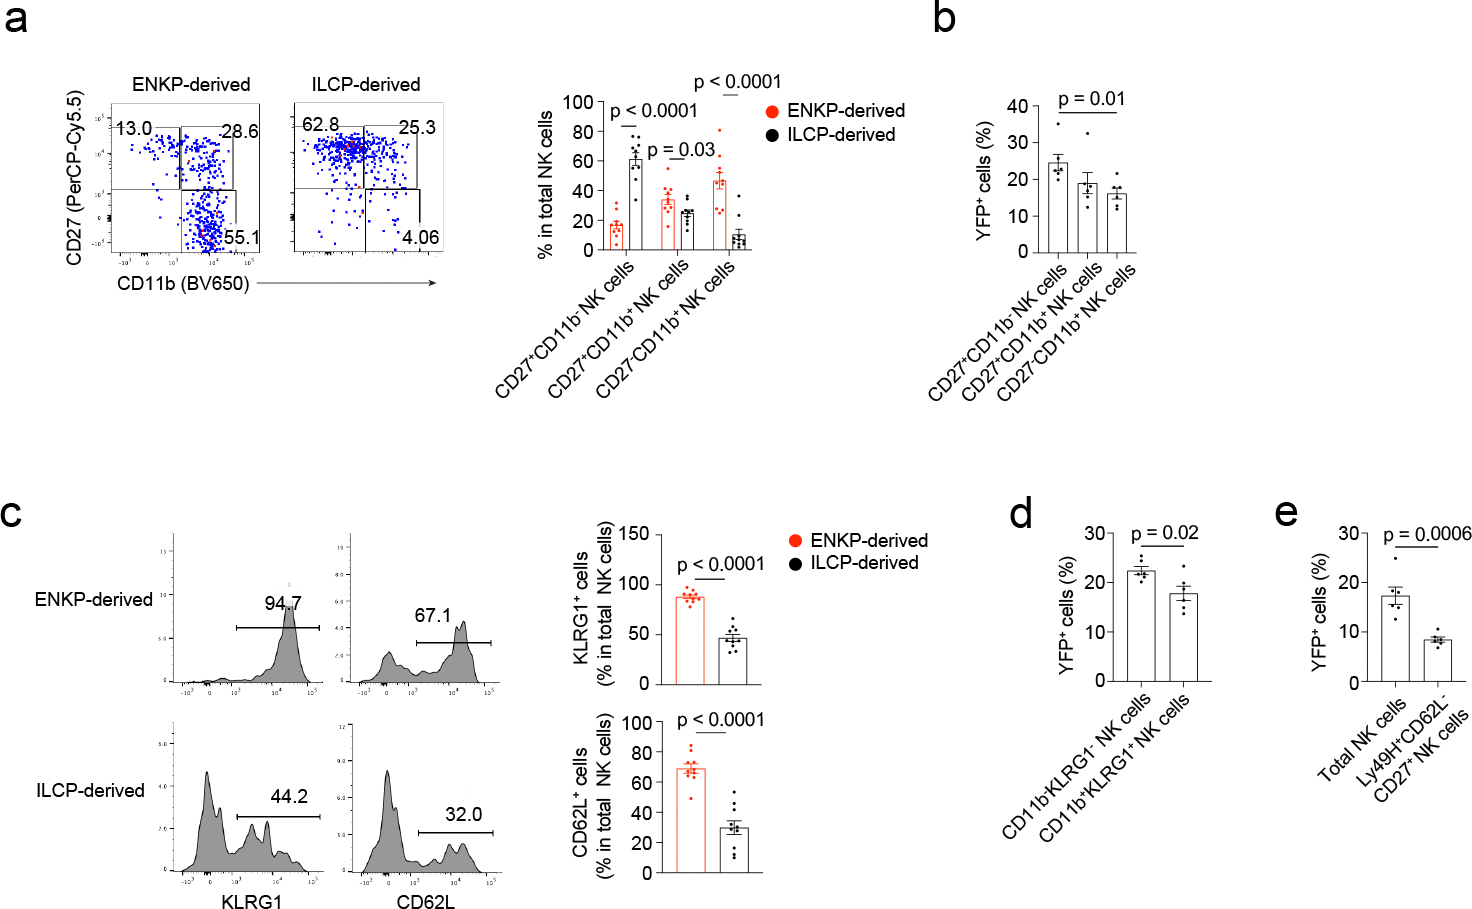
a, Representative flow plots and quantification of frequencies of NK subsets in spleen NK cells derived from ENKPs or ILCPs combined from 2 independent experiments. n = 10. b, Quantification of PLZF-tracing ratios in spleen NK subsets from NSG PLZF-tracing long-term chimeras combined from 2 independent experiments. n = 6. c, Representative histograms and quantification of frequencies of cells expressing specific surface markers in spleen NK cells derived from ENKPs or ILCPs combined from 2 independent experiments. n = 10. d, Quantification of PLZF-tracing ratios in spleen NK subsets from NSG PLZF-tracing long-term chimeras from 2 independent experiments. n = 6. e, Quantification of PLZF-tracing ratios in spleen total NK cells and NK subset from NSG PLZF-tracing long-term chimeras combined from 2 independent experiments. n = 6. For a - e, data are mean ± s.e.m., and statistical analysis was performed using two-tailed unpaired Student’s t-tests.
Extended Data Fig. 10. Characterization of functions of NK subsets.

a, Representative flow plots and quantification of frequencies of cells expressing cytokines or CD107a in NK subsets, representative data from 2 independent experiments. n = 4. b, Quantification of specific lysis ratios of Yac-1 cells co-cultured with NK subsets, representative data from 2 independent experiments. n = 4. c, Histogram of IFN-γ expression of in vitro differentiated ENKP_NK cells and ILCP_NK cells after stimulation. Representative histograms from 2 independent experiments. d - e, Representative flow plots of gating (d) and IFN-γ expression (e) of NK subsets and ILC1s from cecum lamina propria (LP) after Salmonella infection. f - g, Representative flow plots of gating (f) and IFN-γ expression (g) of NK subsets and ILC1s from ear skin after HSV infection. For a, b, ENKP_NK-enriched population, Ly49H+ and/or Ly49D+; ILCP_NK-enriched population, Ly49H−Ly49D−CD226+(Thy1.2+ and/or CXCR3+). For e, g, ENKP_NK-enriched population, Ly49H+ and/or Ly49D+; ILCP_NK-enriched population, Ly49H−Ly49D−CD226+Thy1.2+. For a, b, data are mean ± s.e.m, and statistical analysis was performed using two-tailed unpaired Student’s t-tests.
Acknowledgements
We thank V. Lazarevic and C. Spinner for help acquiring mouse strains, and V. Shapiro for critical comments on the manuscript. We are grateful for support by the staff of the NCI CCR Single Cell Analysis Facility for sequencing BM and spleen samples and support by the staff of CCR/NCI flow cytometry core for cell sorting. This work is supported by the Division of Intramural Research of the NCI, NIAID and NHLBI, ANR JCJC AAPG2022: ANR-22-CE15-0040-01 (C.H.).
Footnotes
Competing interests
Authors declare that they have no competing interests.
Data availability
Single cell RNA sequencing data are available from the NCBI Gene Expression Omnibus (GEO) repository (accession number: GSE266109).
References
- 1.Vivier E et al. Innate Lymphoid Cells: 10 Years On. Cell 174, 1054–1066 (2018). [DOI] [PubMed] [Google Scholar]
- 2.Yang Q et al. TCF-1 upregulation identifies early innate lymphoid progenitors in the bone marrow. Nat Immunol 16, 1044–1050 (2015). [DOI] [PMC free article] [PubMed] [Google Scholar]
- 3.Constantinides MG, McDonald BD, Verhoef PA & Bendelac A A committed precursor to innate lymphoid cells. Nature 508, 397–401 (2014). [DOI] [PMC free article] [PubMed] [Google Scholar]
- 4.Xu W et al. An Id2(RFP)-Reporter Mouse Redefines Innate Lymphoid Cell Precursor Potentials. Immunity 50, 1054–1068 e1053 (2019). [DOI] [PMC free article] [PubMed] [Google Scholar]
- 5.Klose CSN et al. Differentiation of type 1 ILCs from a common progenitor to all helper-like innate lymphoid cell lineages. Cell 157, 340–356 (2014). [DOI] [PubMed] [Google Scholar]
- 6.Fathman JW, Bhattacharya D, Inlay MA, Seita J, Karsunky H & Weissman IL Identification of the earliest natural killer cell-committed progenitor in murine bone marrow. Blood 118, 5439–5447 (2011). [DOI] [PMC free article] [PubMed] [Google Scholar]
- 7.Constantinides MG et al. PLZF expression maps the early stages of ILC1 lineage development. Proc Natl Acad Sci U S A 112, 5123–5128 (2015). [DOI] [PMC free article] [PubMed] [Google Scholar]
- 8.Park E et al. Toxoplasma gondii infection drives conversion of NK cells into ILC1-like cells. Elife 8 (2019). [DOI] [PMC free article] [PubMed] [Google Scholar]
- 9.McFarland AP et al. Multi-tissue single-cell analysis deconstructs the complex programs of mouse natural killer and type 1 innate lymphoid cells in tissues and circulation. Immunity 54, 1320–1337 e1324 (2021). [DOI] [PMC free article] [PubMed] [Google Scholar]
- 10.Collins PL et al. Gene Regulatory Programs Conferring Phenotypic Identities to Human NK Cells. Cell 176, 348–360 e312 (2019). [DOI] [PMC free article] [PubMed] [Google Scholar]
- 11.Dogra P et al. Tissue Determinants of Human NK Cell Development, Function, and Residence. Cell 180, 749–763 e713 (2020). [DOI] [PMC free article] [PubMed] [Google Scholar]
- 12.Karo JM, Schatz DG & Sun JC The RAG recombinase dictates functional heterogeneity and cellular fitness in natural killer cells. Cell 159, 94–107 (2014). [DOI] [PMC free article] [PubMed] [Google Scholar]
- 13.Sun JC, Beilke JN & Lanier LL Adaptive immune features of natural killer cells. Nature 457, 557–561 (2009). [DOI] [PMC free article] [PubMed] [Google Scholar]
- 14.Smith HR et al. Recognition of a virus-encoded ligand by a natural killer cell activation receptor. Proc Natl Acad Sci U S A 99, 8826–8831 (2002). [DOI] [PMC free article] [PubMed] [Google Scholar]
- 15.Harly C, Cam M, Kaye J & Bhandoola A Development and differentiation of early innate lymphoid progenitors. J Exp Med 215, 249–262 (2018). [DOI] [PMC free article] [PubMed] [Google Scholar]
- 16.Harly C et al. The transcription factor TCF-1 enforces commitment to the innate lymphoid cell lineage. Nat Immunol 20, 1150–1160 (2019). [DOI] [PMC free article] [PubMed] [Google Scholar]
- 17.Rodriguez-Rodriguez N et al. Identification of aceNKPs, a committed common progenitor population of the ILC1 and NK cell continuum. Proc Natl Acad Sci U S A 119, e2203454119 (2022). [DOI] [PMC free article] [PubMed] [Google Scholar]
- 18.Zeis P et al. In Situ Maturation and Tissue Adaptation of Type 2 Innate Lymphoid Cell Progenitors. Immunity 53, 775–792 e779 (2020). [DOI] [PMC free article] [PubMed] [Google Scholar]
- 19.Lim AI et al. Systemic Human ILC Precursors Provide a Substrate for Tissue ILC Differentiation. Cell 168, 1086–1100 e1010 (2017). [DOI] [PubMed] [Google Scholar]
- 20.Gascoyne DM et al. The basic leucine zipper transcription factor E4BP4 is essential for natural killer cell development. Nat Immunol 10, 1118–1124 (2009). [DOI] [PubMed] [Google Scholar]
- 21.Gordon SM et al. The transcription factors T-bet and Eomes control key checkpoints of natural killer cell maturation. Immunity 36, 55–67 (2012). [DOI] [PMC free article] [PubMed] [Google Scholar]
- 22.Yagi R et al. The transcription factor GATA3 is critical for the development of all IL-7Ralpha-expressing innate lymphoid cells. Immunity 40, 378–388 (2014). [DOI] [PMC free article] [PubMed] [Google Scholar]
- 23.Zhong C et al. Differential Expression of the Transcription Factor GATA3 Specifies Lineage and Functions of Innate Lymphoid Cells. Immunity 52, 83–95 e84 (2020). [DOI] [PMC free article] [PubMed] [Google Scholar]
- 24.Schlenner SM et al. Fate mapping reveals separate origins of T cells and myeloid lineages in the thymus. Immunity 32, 426–436 (2010). [DOI] [PubMed] [Google Scholar]
- 25.Weizman OE et al. ILC1 Confer Early Host Protection at Initial Sites of Viral Infection. Cell 171, 795–808 e712 (2017). [DOI] [PMC free article] [PubMed] [Google Scholar]
- 26.Nixon BG et al. Cytotoxic granzyme C-expressing ILC1s contribute to antitumor immunity and neonatal autoimmunity. Sci Immunol 7, eabi8642 (2022). [DOI] [PMC free article] [PubMed] [Google Scholar]
- 27.Sojka DK et al. Tissue-resident natural killer (NK) cells are cell lineages distinct from thymic and conventional splenic NK cells. Elife 3, e01659 (2014). [DOI] [PMC free article] [PubMed] [Google Scholar]
- 28.Friedrich C et al. Effector differentiation downstream of lineage commitment in ILC1s is driven by Hobit across tissues. Nat Immunol 22, 1256–1267 (2021). [DOI] [PMC free article] [PubMed] [Google Scholar]
- 29.Ricardo-Gonzalez RR et al. Tissue signals imprint ILC2 identity with anticipatory function. Nat Immunol 19, 1093–1099 (2018). [DOI] [PMC free article] [PubMed] [Google Scholar]
- 30.Fehniger TA et al. Differential cytokine and chemokine gene expression by human NK cells following activation with IL-18 or IL-15 in combination with IL-12: implications for the innate immune response. J Immunol 162, 4511–4520 (1999). [PubMed] [Google Scholar]
- 31.Yang C et al. Heterogeneity of human bone marrow and blood natural killer cells defined by single-cell transcriptome. Nat Commun 10, 3931 (2019). [DOI] [PMC free article] [PubMed] [Google Scholar]
- 32.Ruckert T, Lareau CA, Mashreghi MF, Ludwig LS & Romagnani C Clonal expansion and epigenetic inheritance of long-lasting NK cell memory. Nat Immunol 23, 1551–1563 (2022). [DOI] [PMC free article] [PubMed] [Google Scholar]
- 33.Beziat V et al. NK cell responses to cytomegalovirus infection lead to stable imprints in the human KIR repertoire and involve activating KIRs. Blood 121, 2678–2688 (2013). [DOI] [PMC free article] [PubMed] [Google Scholar]
- 34.Jacobs R et al. CD56bright cells differ in their KIR repertoire and cytotoxic features from CD56dim NK cells. Eur J Immunol 31, 3121–3127 (2001). [DOI] [PubMed] [Google Scholar]
- 35.Dokun AO, Kim S, Smith HR, Kang HS, Chu DT & Yokoyama WM Specific and nonspecific NK cell activation during virus infection. Nat Immunol 2, 951–956 (2001). [DOI] [PubMed] [Google Scholar]
- 36.Chiossone L, Chaix J, Fuseri N, Roth C, Vivier E & Walzer T Maturation of mouse NK cells is a 4-stage developmental program. Blood 113, 5488–5496 (2009). [DOI] [PubMed] [Google Scholar]
- 37.Huntington ND et al. NK cell maturation and peripheral homeostasis is associated with KLRG1 up-regulation. J Immunol 178, 4764–4770 (2007). [DOI] [PubMed] [Google Scholar]
- 38.Flommersfeld S et al. Fate mapping of single NK cells identifies a type 1 innate lymphoid-like lineage that bridges innate and adaptive recognition of viral infection. Immunity 54, 2288–2304 e2287 (2021). [DOI] [PMC free article] [PubMed] [Google Scholar]
- 39.Harrington L, Srikanth CV, Antony R, Shi HN & Cherayil BJ A role for natural killer cells in intestinal inflammation caused by infection with Salmonella enterica serovar Typhimurium. FEMS Immunol Med Microbiol 51, 372–380 (2007). [DOI] [PMC free article] [PubMed] [Google Scholar]
- 40.Habu S, Akamatsu K, Tamaoki N & Okumura K In vivo significance of NK cell on resistance against virus (HSV-1) infections in mice. J Immunol 133, 2743–2747 (1984). [PubMed] [Google Scholar]
- 41.O’Sullivan TE, Sun JC & Lanier LL Natural Killer Cell Memory. Immunity 43, 634–645 (2015). [DOI] [PMC free article] [PubMed] [Google Scholar]
- 42.Lopez-Verges S et al. Expansion of a unique CD57(+)NKG2Chi natural killer cell subset during acute human cytomegalovirus infection. Proc Natl Acad Sci U S A 108, 14725–14732 (2011). [DOI] [PMC free article] [PubMed] [Google Scholar]
- 43.Cooper MA et al. Human natural killer cells: a unique innate immunoregulatory role for the CD56(bright) subset. Blood 97, 3146–3151 (2001). [DOI] [PubMed] [Google Scholar]
- 44.Fauriat C, Long EO, Ljunggren HG & Bryceson YT Regulation of human NK-cell cytokine and chemokine production by target cell recognition. Blood 115, 2167–2176 (2010). [DOI] [PMC free article] [PubMed] [Google Scholar]
- 45.Poli A, Michel T, Theresine M, Andres E, Hentges F & Zimmer J CD56bright natural killer (NK) cells: an important NK cell subset. Immunology 126, 458–465 (2009). [DOI] [PMC free article] [PubMed] [Google Scholar]
- 46.Wu C et al. Clonal tracking of rhesus macaque hematopoiesis highlights a distinct lineage origin for natural killer cells. Cell Stem Cell 14, 486–499 (2014). [DOI] [PMC free article] [PubMed] [Google Scholar]
- 47.Wang R et al. T cell factor 1 regulates thymocyte survival via a RORgammat-dependent pathway. J Immunol 187, 5964–5973 (2011). [DOI] [PMC free article] [PubMed] [Google Scholar]
- 48.Zhu Y et al. T-bet and eomesodermin are required for T cell-mediated antitumor immune responses. J Immunol 185, 3174–3183 (2010). [DOI] [PubMed] [Google Scholar]
- 49.Daussy C et al. T-bet and Eomes instruct the development of two distinct natural killer cell lineages in the liver and in the bone marrow. J Exp Med 211, 563–577 (2014). [DOI] [PMC free article] [PubMed] [Google Scholar]
- 50.Kashiwada M et al. IL-4-induced transcription factor NFIL3/E4BP4 controls IgE class switching. Proc Natl Acad Sci U S A 107, 821–826 (2010). [DOI] [PMC free article] [PubMed] [Google Scholar]
- 51.Hao Y et al. Integrated analysis of multimodal single-cell data. Cell 184, 3573–3587 e3529 (2021). [DOI] [PMC free article] [PubMed] [Google Scholar]
- 52.Street K et al. Slingshot: cell lineage and pseudotime inference for single-cell transcriptomics. BMC Genomics 19, 477 (2018). [DOI] [PMC free article] [PubMed] [Google Scholar]
- 53.Adams NM et al. Cytomegalovirus Infection Drives Avidity Selection of Natural Killer Cells. Immunity 50, 1381–1390 e1385 (2019). [DOI] [PMC free article] [PubMed] [Google Scholar]
- 54.Stacy A et al. Infection trains the host for microbiota-enhanced resistance to pathogens. Cell 184, 615–627 e617 (2021). [DOI] [PMC free article] [PubMed] [Google Scholar]
Associated Data
This section collects any data citations, data availability statements, or supplementary materials included in this article.
Data Availability Statement
Single cell RNA sequencing data are available from the NCBI Gene Expression Omnibus (GEO) repository (accession number: GSE266109).