


Fig. 8.
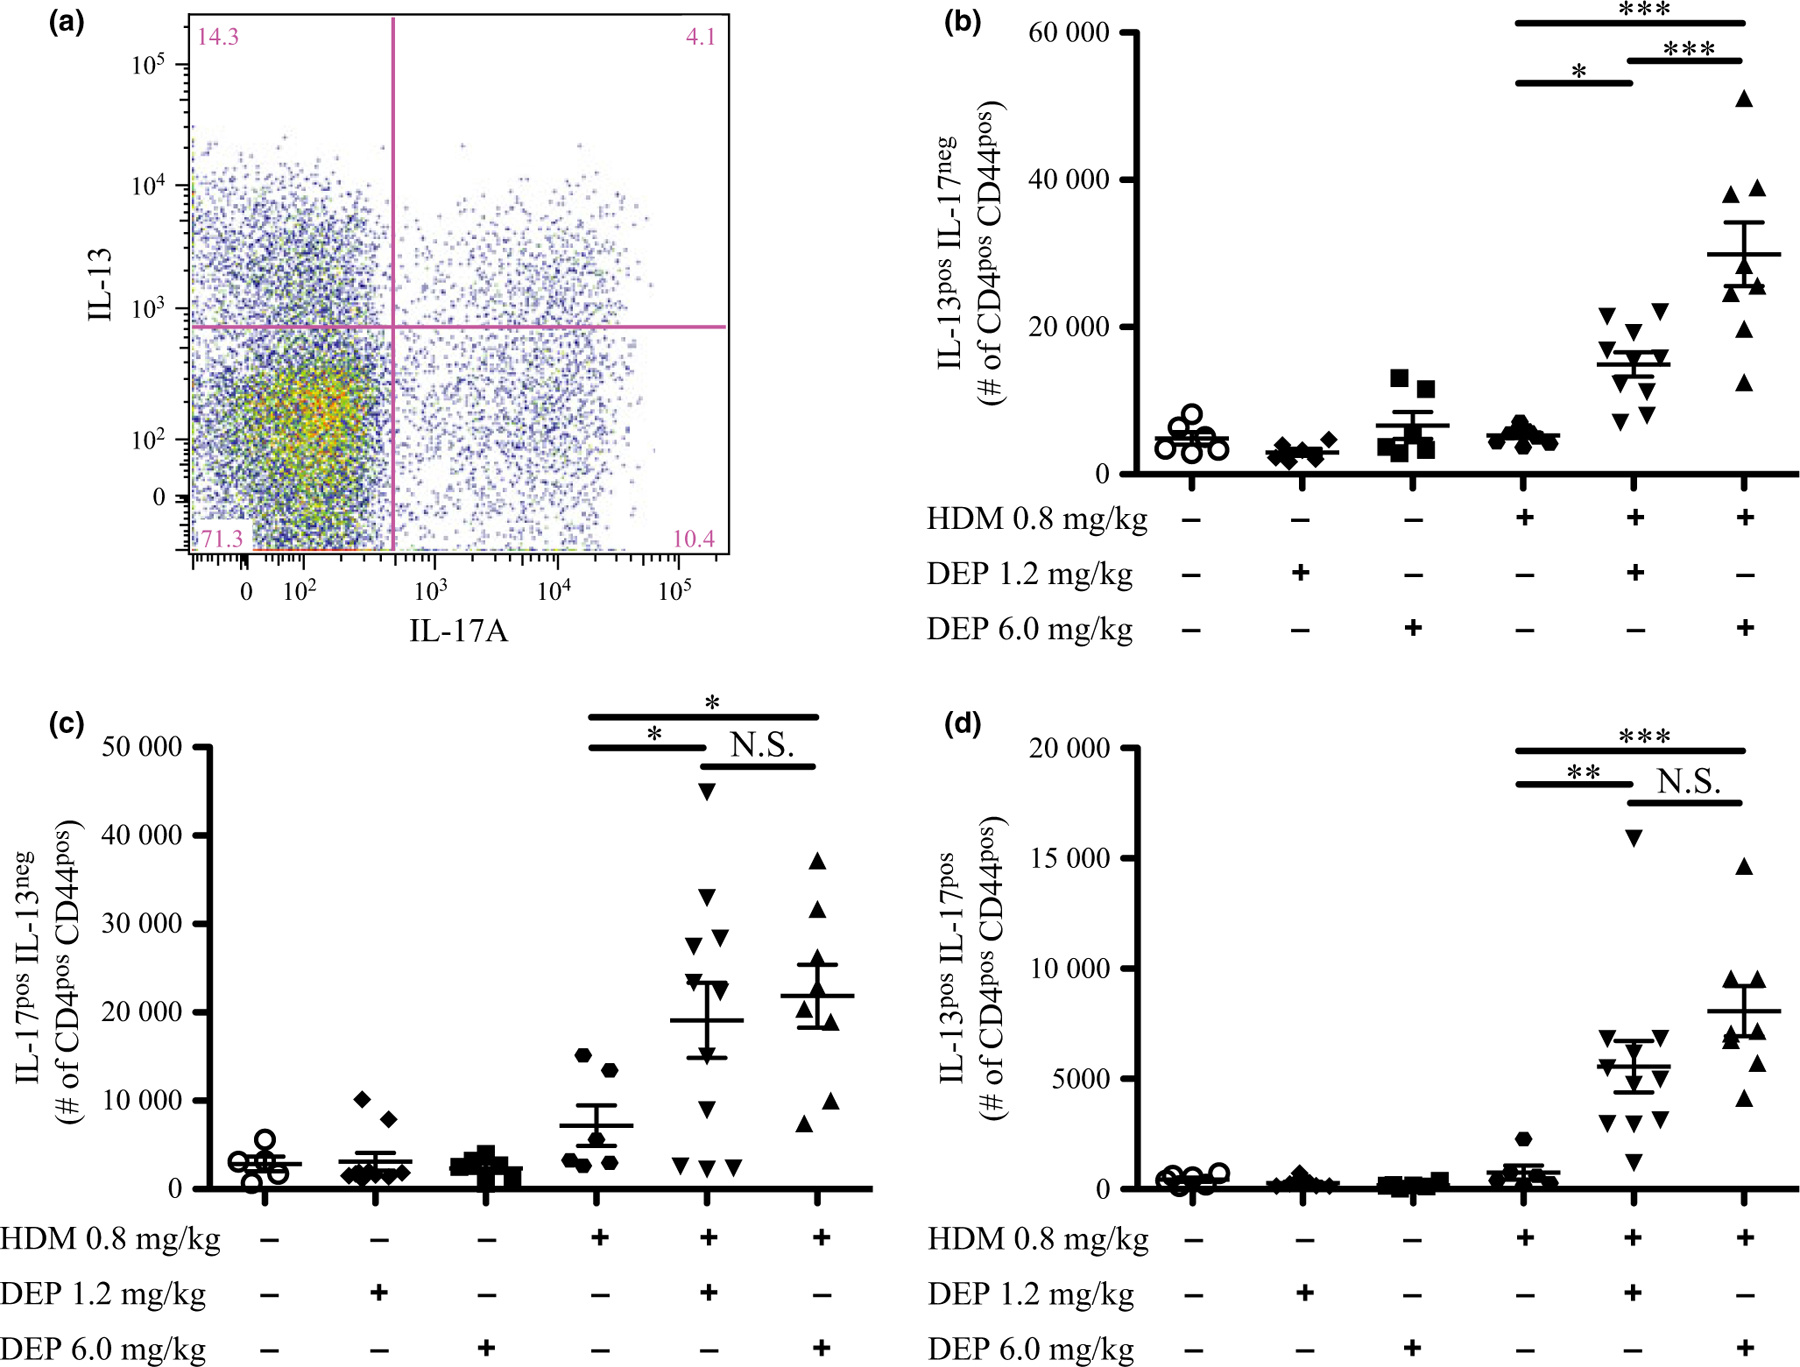
IL-13pos, IL-17Apos, and dual-positive (IL-13pos/IL-17Apos) effector T cells increase following DEP and allergen exposure. Flow cytometry analysis was performed on effector T cells from exposure groups stained for intracellular cytokines IL-13 and IL-17A, after ex vivo restimulation. A sample gating strategy (a) shows the separation of effector T cells that were only IL-13pos (b), only IL-17Apos (c), and positive for both (IL-13pos/IL-17Apos) (d). The number of each cell type is depicted. Changes in percentages of cell types are shown in supplemental data (Fig. S7a–c). The full gating strategy is also shown in supplemental data (Fig. S8d). Statistical significance was determined to be P < 0.05 (*), P < 0.01 (**), and P < 0.001 (***) or not significant if P > 0.05 (N.S.). Error bars shown represent the standard error of mean (±SEM). The number of animals per group was 6–11.