


Figure 5. Functional knock-out of Dop1R1 in ITP+ LNs decreases morning wakefulness and increases sleep after the onset of light.
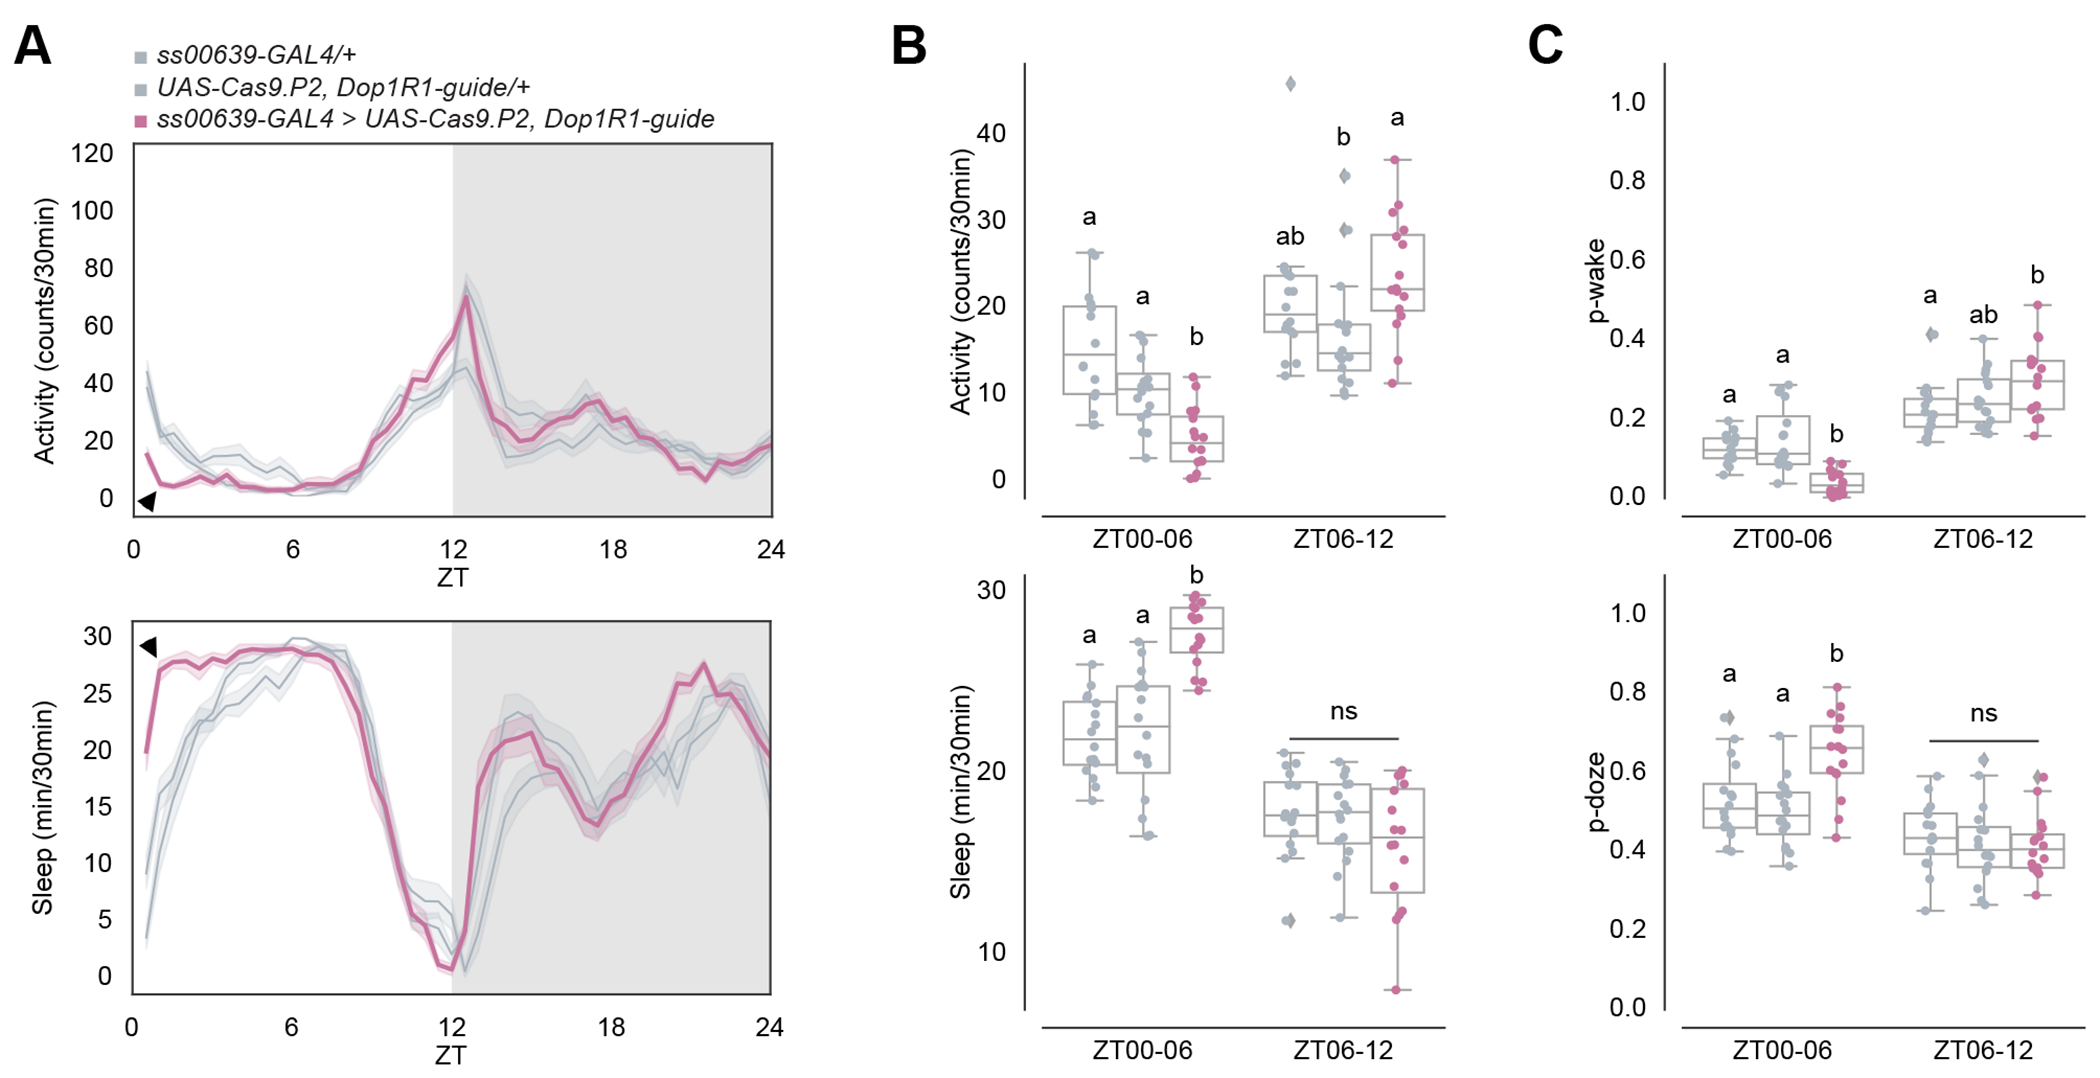
(A) Timeseries plots of activity (top) and sleep (bottom) of male flies with Dop1R1 knock-out in ITP+ LNs in 12:12 LD. Heterozygous ss00639-GAL4 (n=16) and UAS-Cas9.P2, Dop1R1-guide (n=16) controls are in gray. Experimental flies (n=16) expressing all transgenes are colored. Bold lines are means and shaded regions are 95% confidence intervals of the means. Black arrowheads point to the major difference between control and experimental flies between ZT00 and ZT06.
(B) Boxplots quantifying activity (top) and sleep (bottom) of male flies with Dop1R1 knock-out in ITP+ LNs during ZT00-06 and ZT06-12 daytime bins. Genotypes are depicted by the same color scheme as in (A). Letters represent statistically distinct groups as tested by a Kruskal Wallis test, post-hoc Mann Whitney U multiple comparisons method, and a Bonferroni-corrected significance value of p < 0.01667. Groups labeled with “ns” are not statistically distinct.
(C) Boxplots quantifying p-wake (top) and p-doze (bottom) of male flies with Dop1R1 knock-out in ITP+ LNs during ZT00-06 and ZT06-12 daytime bins. Genotypes are depicted by the same color scheme as in (A). Letters represent statistically distinct groups as tested by a Kruskal Wallis test, post-hoc Mann Whitney U multiple comparisons method, and a Bonferroni-corrected significance value of p < 0.01667. Groups labeled with “ns” are not statistically distinct.
See also Figure S5.