



Abstract
Although Th17 cells reportedly play critical roles in the development of autoimmunity and allergic reactions, information on Th17 cells in cancer‐bearing hosts is still limited. In the present study, we investigated the distribution of Th17 cells in relation to regulatory T cells (Treg) in the tumor‐infiltrating lymphocytes (TILs), regional lymph node lymphocytes, and peripheral blood lymphocytes of gastric cancer patients. Interleukin (IL)‐17‐producing CD4(+) cells as Th17 cells and CD4(+)CD25(+)FoxP3(+) cells as Treg were evaluated by flow cytometry and expressed as a percentage of the total CD4+ cells, in addition to performing a Th1/Th2 balance assay. Moreover, immunohistochemical staining for IL‐17 and FoxP3 were performed. In TILs from patients with early disease (n = 27), the frequency of Th17 cells was significantly higher than that in the normal gastric mucosa (23.7 ± 8.9 vs 4.5 ± 3.1%). In TILs from patients with advanced disease (n = 28), the frequency of Th17 cells was also significantly higher, but lower compared to early disease, than that in the normal gastric mucosa (15.1 ± 6.2 vs 4.0 ± 2.0%). This observation for Th17 cell‐distribution was also confirmed by immunohistochemistry. When the ratio of Th17/Treg in TILs was evaluated in individual cases, it was more markedly increased in early than in advanced disease. In conclusion, the accumulation of Th17 cells as well as Treg in the tumor microenvironment of gastric cancer occurred in early disease and then the infiltration of Th17 cells gradually decreased according to the disease progression, in contrast to increased Treg. (Cancer Sci 2010; 00: 00–00)
Gastric cancer is one of the most common cancers throughout the world. Despite efforts to introduce new treatment modalities such as surgery combined with chemotherapy( 1 ) or chemo‐radiotherapy( 2 ), the control of gastric cancer at an advanced stage remains difficult. It has been shown that the infiltrating grade of CD3(+) tumor‐infiltrating lymphocytes (TILs) was correlated with a favorable outcome in patients with several types of cancer, including gastric cancer.( 3 , 4 ) Thus, it is important to understand immunoregulation in gastric cancer, in order to develop novel treatment strategies or improve the efficacy of standard therapy.
It has been reported that naïve CD4(+) helper T cells can develop into four types of T cells: Th1, Th2, Th17, and regulatory T cells (Treg), based on the local cytokine milieu, and the balance between these four types of helper T cell is important for the regulation of immune responses in several mouse models,( 5 , 6 , 7 ) although information in humans is still limited and controversial. Th17 cells are characterized as interleukin (IL)‐17‐producing CD4(+) T cells which also produce IL‐21, IL‐22, and IL‐26.( 5 , 6 , 7 ) It has been reported that retinoid orphan nuclear receptor (RORC) is a key regulator of Th17 cell lineage differentiation,( 8 , 9 ) and that Th17 cells play critical roles in the development of autoimmunity and allergic reactions.( 10 , 11 ) However, information on Th17 cells in cancer‐bearing hosts is still limited, although there are a few reports that Th17 cells may play active roles in antitumor immunity.( 12 , 13 , 14 , 15 )
Regulatory T cells (Treg) play important roles in immunological self‐tolerance, and are functionally immunosuppressive subsets of T cells.( 16 , 17 ) There is accumulating evidence that an increased population of Treg in TILs or PBMCs is one of the reasons for impaired antitumor immunity in cancer‐bearing hosts.( 18 , 19 , 20 ) We have reported that the frequency of Treg among TILs, lymphocytes derived from tumor‐draining regional lymph nodes, and PBMCs was higher in patients with gastric cancer in comparison to their normal counterparts.( 21 ) It has been shown that the balance between Treg and Th17 cells is a key factor that regulates helper T‐cell function relating to the Th1/Th2 shift in autoimmune disease and graft versus host disease (GVHD).( 22 ) However, there is limited information on the balance between Treg and Th17 cells in cancer patients.( 14 )
In the present study, we investigated the distribution of Th17 cells in relation to Treg in TILs, regional lymph node lymphocytes (RLNLs), and PBMCs of patients with gastric cancer.
Materials and Methods
Patients. Fifty‐five consecutive patients with gastric cancer, who were operated on in the University of Yamanashi Hospital from 2009 to 2008, were enrolled in the present study. The characteristics of the patients are summarized in Table 1. Patients with gastric cancer were divided into two groups: those with early disease (n = 27) corresponding to stage I according to the TNM classification for gastric cancer (International Union Against Cancer, UICC), and those with advanced disease corresponding to stages II, III, and IV (n = 28). Regional lymph nodes in the stomach were classified into N1 regional lymph nodes adjacent to the gastric tumor and N2 regional lymph nodes marginally distant from the tumor, according to the Japanese Classification of Gastric Carcinoma.( 23 ) Mesenteric lymph nodes, which were not regional lymph nodes of the stomach, were used as control lymph nodes.
Table 1.
Characteristics of patients with gastric cancer
| Early disease (n = 27) | Advanced disease (n = 28) | |
|---|---|---|
| Age (mean ±SD) (years) | 71.5 ± 9.0 | 70.3 ± 11.4 |
| Sex | ||
| Male | 15 | 19 |
| Female | 12 | 9 |
| Stage† | ||
| I | 27 | 0 |
| II | – | 12 |
| III | – | 9 |
| IV | – | 7 |
| Histology | ||
| Differentiated adenocarinoma | 15 | 12 |
| Undifferentiated adenocarcinoma | 12 | 16 |
| Tumor† | ||
| T1 | 27 | 3 |
| T2 | – | 10 |
| T3 | – | 10 |
| T4 | – | 5 |
| Lymph node metastasis‡ | ||
| N0 | 27 | 6 |
| N1 | – | 14 |
| N2 | – | 4 |
| N3 | – | 4 |
| Lymphatic invasion‡ | ||
| ly0 | 23 | 2 |
| ly1 | 3 | 10 |
| ly2 | 1 | 11 |
| ly3 | 0 | 5 |
| Venous invasion‡ | ||
| v0 | 21 | 6 |
| v1 | 5 | 11 |
| v2 | 1 | 8 |
| v3 | 0 | 3 |
Early disease, stage I; advanced disease, stages II, III, and IV.
†Tumor‐node‐metastasis (TNM) classification of gastric cancer (International Union Against Cancer, UICC). ‡Japanese Classification of Gastric Carcinoma.
None of the patients received radiotherapy, chemotherapy, or other medical interventions before the study. Written informed consent was obtained from all individuals. All samples were taken in a blinded manner for clinical information.
Cell preparation. Peripheral blood mononuclear cells (PBMCs) were isolated using Ficoll‐Paque Plus (Amersham Biosciences, Uppsala, Sweden) density gradient solution. Tumor tissue, normal gastric mucosa, and regional lymph nodes from gastric cancer were isolated during surgery and homogenized by mechanical mincing with X‐VIVO15 medium (Cambrex, East Rutherford, NJ, USA). Subsequently, the single‐cell suspension was purified by centrifugation with Ficoll‐Paque Plus.
Flow cytometric analysis of Th17 cells. To analyze the prevalence of Th17 cells, IL‐17‐producing CD4(+) lymphocytes were evaluated. Lymphocytes were incubated in X‐VIVO15 medium in the presence of PMA (50 mg/mL; Sigma‐Aldrich, St. Louis, MO, USA), Ionomycin (800 mg/mL; Sigma), and Monensin (2 mM; eBioscience, San Diego, CA, USA) for 4 h at 37°C. Then, cells were stained with CD4‐APC (R&D Systems, Minneapolis, MN, USA) for 30 min at 4°C, followed by treatment with Fixation/Permeabilization Reagent (eBioscience) for 45 min at 4°C, and stained with IL‐17A‐PE mAb (eBio64DEC17; eBioscience) in combination with mouse IgG1 k mAb (eBioscience) as an isotype control for 30 min at 4°C. Then, the number of IL‐17‐positive cells on the gating of CD4+ cells was evaluated, and the frequency of Th17 cells was expressed as a percentage of the total CD4+ cells.
Flow cytometric analysis of Treg. To analyze the prevalence of T‐regs, CD4+CD25+FoxP3+ cells were evaluated using the Human Regulatory T‐cell Staining Kit (eBioscience) according to the manufacturer’s protocol. Briefly, the single‐cell suspension was stained using a cocktail of anti‐CD4‐FITC mAb and anti‐CD25‐APC mAb, and, then, after permeabilization, samples were blocked by normal rat serum, and stained using anti‐FoxP3‐phycoerythrin (PE) mAb or PE‐conjugated rat IgG2a used as an isotype control. Subsequently, the number of FoxP3‐positive cells on the gating of CD4+ cells was evaluated, and the frequency of FoxP3+ T‐regs was expressed as a percentage of the total CD4+ cells.
Flow cytometric analysis of Th1/Th2. Lymphocytes were incubated in X‐VIVO15 medium in the presence of PMA (50 mg/mL; Sigma), Ionomycin (800 mg/mL; Sigma), and Brefeldin A (3 mg/mL; eBioscience) for 4 h at 37°C. Then, cells were stained with CD4‐APC (R&D Systems) for 30 min at 4°C which was followed by treatment with Fixation/Permeabilization Reagent (eBioscience) for 45 min at 4°C. For the analysis of Th1, lymphocytes were stained with IFN‐γ‐PE mAb (R&D Systems) in combination with IgG2b mAb (R&D Systems) as an isotype control for 30 min at 4°C. For the analysis of Th2, lymphocytes were stained with IL‐4‐PE (R&D Systems) in combination with mouse IgG1 (R&D Systems) as an isotype control for 30 min at 4°C. Then, the percentage of IFN‐γ‐positive or IL‐4‐positive cells on the gating of CD4+ cells was evaluated.
Cytokine production by T cells. Peripheral blood mononuclear cells (PBMCs) (5.0 × 10⁶ cells) or regional lymph node lymphocytes (RLNLs; 5.0 × 10⁶ cells) were incubated with 1 mL of X‐VIVO15 medium for 72 h in a 48‐well plate (Coaster, Cambridge, MA, USA) pre‐coated with anti‐CD3 mAb (2.5 μg/mL, OKT3; Miltenyi Biotec, Auburn, CA, USA) plus anti‐CD28 mAb (1.25 μg/mL; 15E8, Miltenyi Biotec) to induce cytokine production. The obtained supernatants were stored at −70°C and their contents were determined using ELISA kits (Human IL‐17A, Human IL‐21, and Human IL‐23 [p19/p40] Kits; eBioscience), according to the manufacturer’s recommendations.
Immunohistochemistry. Interleukin (IL)‐17‐staining of tissue sections with gastric cancer was conducted using the Cell & Tissue Staining Kit (HRP‐DAB system; R&D Systems) on paraffin‐embedded 4‐μm‐thick sections. Briefly, each paraffin section was deparaffinized, followed by antigen retrieval with Epitope Retrieval Solution (DakoCytomation, Glostrup, Denmark) in a preheated water bath (98°C, 40 min). Endogenous peroxidase was blocked, and antihuman IL‐17 antibody (10 mg/mL; R&D Systems) was applied overnight at 4°C. Thereafter, the sections were incubated with secondary Abs as per the Cell & Tissue Staining Kit, and counter‐stained with hematoxylin. Negative control staining was performed with goat IgG mAb (R&D Systems) instead of the specific primary antibody.
FoxP3‐staining was conducted using the avidin–biotin–peroxidase complex method (LSAB+ System‐HRP; Dako, Glostrup, Denmark). Briefly, each paraffin section was dewaxed, followed by antigen retrieval with Target Retrieval Solution (10 mmol citrate buffer [pH 9.0]; Dako) in a preheated water bath (98°C, 40 min), and endogenous peroxidase was blocked by Chemmate Peroxidase Blocking Solution (Dako). Then, biotinylated antihuman FoxP3 antibody (diluted by PBS, 1:20; eBioscience) was applied for 40 min at room temperature. Thereafter, the sections were incubated with streptavidin‐conjugated horseradish peroxidase (Dako) for 10 min, followed by development with 3, 3′‐diaminobenzidine (Dako) for 5 min, and counter‐staining with hematoxylin. Negative control staining was performed with isotype control, mouse IgG2a (Dako), instead of the primary antibody.
Statistical analysis. The non‐paired Student’s t‐test was used to examine differences between the groups. Correlations between values were evaluated using non‐parametric Spearman’s rank correlation. Findings were considered significant when P‐values were <0.05.
Results
Distribution of Th17 cells in gastric cancer. Representative flow cytometric data in TILs from an early disease case showed that IL‐17‐producing CD4(+) cells could be quantitatively evaluated by intracellular staining with flow cytometry (Fig. 1a). In TILs from patients with early disease, the frequency of Th17 cells was significantly higher than that in intra‐epithelial lymphocytes (IELs) of normal gastric mucosa in the same cohorts (23.7 ± 8.9 vs 4.5 ± 3.1%) (Fig. 1b). Also, in TILs from patients with advanced disease, the frequency of Th17 cells was significantly higher than that in IELs of normal gastric mucosa in the same cohorts (15.1 ± 6.2 vs 4.0 ± 2.0%). These results indicated that Th17 cells more strongly accumulated in TILs in comparison to the normal mucosa in gastric cancer. Of note, the frequency of Th17 cells in TILs from patients with advanced disease was significantly decreased compared to that in those with early disease (15.1 ± 6.2 vs 23.7 ± 8.9%). Furthermore, there was no significant difference regarding the prevalence of Th17 cells in IELs of normal gastric mucosa between early and advanced disease, indicating that the accumulation of Th17 cells in the background mucosa did not differ among patients. In addition, we did not observe any correlation between Th17 prevalence in TILs and Helicobacter pylori (H. pylori) infection (data not shown).
Figure 1.

Prevalence of Th17 cells in gastric cancer. (a) Representative flow cytometric data showing interleukin (IL)‐17‐producing CD4(+) cells. (b) The frequencies of Th17 cells (%Th17) in tumor‐infiltrating lymphocytes (TILs) in comparison to intra‐epithelial lymphocytes (IELs) of normal gastric mucosa are shown. The patients were divided into early disease (early) corresponding to stage I and advanced disease (advanced) corresponding to stages II, III, and IV. (c) The frequencies of Th17 cells (%Th17) in peripheral blood mononuclear cells (PBMCs) in comparison with healthy donors (Healthy). (d) Regional lymph nodes in the stomach were classified into N1 regional lymph nodes adjacent to the gastric tumor and N2 regional lymph nodes marginally distant from the tumor, according to the Japanese Classification of Gastric Carcinoma. Mesenteric lymph nodes were used as control lymph nodes (Nc).
In addition, immunohistochemical staining indicated IL‐17‐positive lymphocytes were frequently observed in early gastric cancer in comparison with advanced gastric cancer, as shown in the representative staining (Fig. 2). Summarized data with quantitative analysis of immunohistochemistry showed that the frequency of Th17 cells in TILs from patients with advanced disease was significantly decreased compared to that in those with early disease (Fig. 2). Thus, regarding the tumor microenvironment, the accumulation of Th17 cells occurred at a relatively early stage of the disease, and their levels of infiltration gradually decreased according to disease progression.
Figure 2.

Immunohistochemical staining for inter‐leukin (IL)‐17 in gastric cancer. Representative immunostaining for IL‐17 is shown for advanced and early gastric cancer in addition to normal gastric mucosa and negative control. Summarized data with quantitative analysis indicated that the frequency of Th17 cells in tumor‐infiltrating lymphocytes (TILs) from patients with advanced disease was significantly decreased compared to that in those with early disease.
In PBMCs from patients with advanced disease, the frequency of Th17 cells was significantly lower than that in healthy donors (6.0 ± 2.0 vs 11.0 ± 3.9%, Fig. 1c). However, there was no significant difference in the frequency of Th17 cells between patients with early disease and healthy donors (9.2 ± 4.0 vs 11.0 ± 3.9%, Fig. 1c).
In RLNLs, the frequency of Th17 cells in N1 regional lymph nodes of all cases was significantly higher than that in non‐regional control lymph nodes (Nc) (19.5 ± 9.8 vs 11.2 ± 7.9%, Fig. 1d). There were no significant differences in the frequency of Th17 cells in N1, N2, or Nc between early and advanced disease (data not shown).
Distribution of Treg in gastric cancer. To analyze the prevalence of Treg, CD4+CD25+FoxP3+ cells were evaluated by flow cytometry and expressed as a percentage of the total CD4+ cells, consistent with our previous report.( 21 ) Representative flow cytometric data in TILs from an advanced disease case was shown in Figure 3(a). In TILs from patients with advanced disease, the frequency of Treg in TILs was significantly higher than that in IELs of normal gastric mucosa (26.9 ± 7.1 vs 5.6 ± 3.2%, Fig. 3b). Furthermore, the frequency of Treg in TILs from patients with early disease was also significantly increased compared to that in IELs of normal gastric mucosa (17.5 ± 5.9 vs 4.1 ± 2.8%). These observations were further confirmed with immunohistochemical analysis, as shown in Fig. 4. Thus, the accumulation of Treg had already occurred at a relatively early stage of the disease and increased according to disease progression, in agreement with our previous report.( 21 )
Figure 3.

Prevalence of regulatory T cells in gastric cancer. (a) Representative flow cytometric data showing CD4(+)CD25(+)FoxP3(+) cells. (b) The frequencies of regulatory T cells (%FoxP3) in tumor‐infiltrating lymphocytes (TILs) in comparison to intra‐epithelial lymphocytes (IELs) of normal gastric mucosa are shown. (c) The frequencies of regulatory T cells (%FoxP3) in peripheral blood mononuclear cells (PBMCs) in comparison with healthy donors (healthy). (d) Prevalence of regulatory T cells in lymph nodes of gastric cancer.
Figure 4.
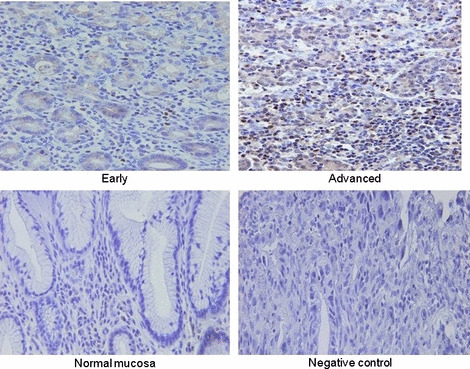
Immunohistochemical staining for FoxP3(+) regulatory T cells in gastric cancer. Representative immuno‐staining for FoxP3 were shown in advanced and early stage of gastric cancer in addition to normal gastric mucosa and negative control.
In PBMCs from patients with advanced disease, the frequency of Treg significantly increased compared to that in healthy donors (5.9 ± 2.1 vs 2.5 ± 1.0%, Fig. 3c), and there was a significant difference in the frequency of Treg in PBMCs between early disease cases and healthy donors (4.3 ± 1.0 vs 2.5 ± 1.0%).
In RLNLs, the frequency of Treg in N1 regional lymph nodes of all cases was significantly higher than that in non‐regional control lymph nodes (Nc) (18.9 ± 6.9 vs 12.1 ± 6.0%, Fig. 3d). There was a significant difference in the frequency of Treg between N1 and N2 lymph nodes (18.9 ± 6.9 vs 13.9 ± 5.5%).
Balance of Th17/Treg according to the progression of gastric cancer. When the ratio of Th17/Treg was evaluated in individual cases, the ratio of Th17/Treg in TILs was significantly elevated in early compared to that in advanced disease, while the ratio in IELs of normal gastric mucosa did not differ between early and advanced disease (Fig. 5a). When each value of Th17 and Treg in TILs in individual cases was plotted (Fig. 5b), the patients with early disease showed a higher Th17 cell level with lower Treg in comparison to patients with advanced disease. Thus, the balance of Th17/Treg in tumor microenvironments shifted from Th17‐dominant to Treg‐dominant according to disease progression.
Figure 5.

Balance of Th17/regulatory T cells (Treg) according to the progression of gastric cancer. (a) The ratio of Th17/Treg was evaluated in individual cases. (b) Each value of the prevalence of Th17 (%Th17) and regulatory T cells (%FoxP3) in tumor‐infiltrating lymphocytes (TILs) was plotted.
Cytokine productions by T cells. In order to confirm IL‐17 production by the T cells tested, supernatants produced by PBMCs or RLNLs in response to CD3 plus CD28 stimulation were evaluated using ELISA. In Figure 6(a,b), the level of IL‐17 production was significantly correlated with the prevalence of Th17 cells evaluated by FACS analysis, confirming the presence of Th17 cells and quantitative accuracy of FACS analysis.
Figure 6.

Cytokine productions of T cells. Supernatant produced by peripheral blood mononuclear cells (PBMCs) or N1 regional lymph node lymphocytes in response to CD3 plus CD28 stimulation was evaluated using ELISA for interleukin (IL)‐17, IL‐21, and IL‐23. In Figure 6(a,b), the levels of IL‐17 production were significantly correlated with the prevalence of Th17 cells evaluated by FACS analysis.
In addition, IL‐21 and IL‐23 production was also measured, since IL‐21 and IL‐23 were reported to be related to the regulation of IL‐17.( 6 ) There was no significant correlation between the prevalence of Th17 cells and production of IL‐21 or IL‐23 (Fig. 6a,b).
Th1/Th2 balance in gastric cancer. In order to further analyze the helper T‐cell balance in gastric cancer, Th1‐type cells (IFN‐γ‐producing cells among CD4[+]) and Th2‐type cells (IL‐4‐producing cells among CD4[+]) were evaluated (Table 2). Tumor‐infiltrating lymphocytes (TILs) in both early and advanced disease revealed that there were increased Th2 cells and decreased Th1 cells in comparison to IELs of normal gastric mucosa, indicating that the balance of Th1/Th2 in TILs was Th2‐shifted in comparison to that in IEL.
Table 2.
Th1/Th2 balance in patients with gastric cancer (n = 55)

In RLNLs, there were no significant differences in the Th1/Th2 balance in N1 or N2 in comparison to that in control lymph nodes (Table 2).
Discussion
The present study provided comprehensive data regarding the Th17/Treg balance relating to disease progression in gastric cancer. Importantly, the accumulation of Th17 cells as well as Treg in the tumor microenvironment occurred at an early stage of the disease and then the infiltration of Th17 cells gradually decreased according to disease progression, in contrast to increased Treg.
There have been several reports describing Th17 cells in human cancer, in which the accumulation of Th17 cells was observed in TILs in prostate,( 15 , 24 ) myeloma,( 25 ) renal cancer,( 26 ) and ovarian cancer.( 14 ) In the present study, we performed a quantitative and comprehensive analysis of Th17 cells in TILs, RLNLs, and PBMCs in gastric cancer. As a result, the accumulation of Th17 cells was observed in TILs at an early stage of gastric cancer, and the infiltration of Th17 cells gradually decreased according to disease progression. This observation was confirmed by both flow cytometric analysis and immunohistochemical staining in the present study. This finding is consistent with a previous report on prostate cancer in which an inverse correlation was noted between Th17‐skewing and the tumor grade.( 24 ) Thus, it is likely that Th17 cells accumulated in the tumor at an early cancer stage and the tumor microenvironment shifted away from Th17‐skewing according to tumor progression.
In contrast to the present human study, it was demonstrated that Th17 cells increased following tumor development and reached maximal levels in advanced tumors in mouse models.( 13 ) This discrepancy may be explained by the difference in tumor biology between mice and humans, whereby transplantable tumors were implanted and grew rapidly in murine tumor models, while human tumors gradually developed and grew slowly. Thus, it is likely that the cytokine profile in the tumor microenvironment differs between mouse and human cancer. In fact, it has recently been shown that the biology of human cancer may reflect chronic or recurrent inflammation, different from murine models.( 27 )
Interleukin (IL)‐17 and IL‐23 have been reported to be related to H. pylori infection( 28 ) in the stomach. In the present study, we did not observe any correlation regarding the prevalence of Th17 within the tumor with H. pylori infection. Moreover, we did not identify a significant difference in the accumulation of Th17 cells in the normal gastric mucosa as a background among all patients. Hence, H. pylori infection did not affect Th17‐skewing in TILs of gastric cancer.
Recent data on human Th17 cells has indicated that IL‐23 is an important inducer of the differentiation of human Th17 cells,( 29 ) and that Th17 polarization is induced by IL‐1β, possibly enhanced by IL‐6, and may be suppressed by transforming growth factor‐β (TGF‐β).( 29 , 30 ) Also, it was shown that Th17 cells related to gut inflammation were regulated by IL‐21.( 31 ) Thus, the fact that there was an increase in Th17 cells in early disease and a gradual decrease in advanced disease in the present study may reflect the local cytokine milieu including IL‐21, IL‐23, IL‐1b, or TGF‐β within the tumor microenvironment of gastric cancer. However, in the present study, we did not observe a direct correlation between the prevalence of Th17 cells and IL‐21 production, or between the prevalence of Th17 cells and IL‐23 production. Furthermore, it has been recently shown that regulated on activation, normal T cell expressed and secreted (RANTES) and monocyte chemotactic protein‐1 (MCP‐1) secreted by tumor cells and tumor‐derived fibroblasts within microenvironment mediate the recruitment of Th17 cells.( 32 ) Further study to clarify which factors regulate Th17 cells within tumor microenvironment will be needed.
We confirmed that the frequency of Treg in TILs was significantly higher than that in normal tissue in patients with gastric cancer, and that Treg are already present in small localized tumors at an early stage of gastric cancer, in agreement with our previous reports.( 21 , 33 ) Taken together, the accumulation of Th17 cells as well as Treg in the tumor microenvironment occurred at an early stage and then the infiltration of Th17 cells gradually decreased according to disease progression, resulting in Treg dominance in the Th17/Treg balance at an advanced stage of gastric cancer. These observations at an advanced stage of cancer are consistent with a recent report on ovarian cancer, wherein the proportions of Th17 cells and Treg were inversely correlated.( 14 ) The mechanisms behind the accumulation of Th17 cells/Treg in the tumor microenvironment are still under investigation. For example, we and others reported that CC chemokine ligand (CCL)22 and CCL17 within the tumor microenvironment are related to the accumulation of Treg through CCR4.( 20 , 21 ) Furthermore, it has been shown that tumor‐associated macrophages are capable of inducing Th17 cell development in vitro, ( 14 ) and that RANTES and MCP‐1 secreted by tumor cells and tumor‐derived fibroblasts within the microenvironment mediate the recruitment of Th17 cells.( 32 ) These dynamic alterations in the Th17/Treg balance may be caused by the cytokine and chemokine profiles according to the progression of cancer. Although the fact that Th17 cells were reciprocally related to Treg suggested an important role of Th17 in antitumor immunity, it remains controversial whether Th17 cells promote tumor growth or regulate antitumor response. Alternatively, increased Th17 at early stage may reflect cytokine profile in acute inflammation, while decreased Th17 at advanced stage may reflect cytokine profile in chronic and recurrent inflammation.
Although in general, Th1/Th2 balance is thought to be shifted towards a Th2‐type in malignancy, there is still controversy regarding the Th1/Th2 balance in the TILs, lymph nodes, and peripheral blood lymphocytes (PBLs) of patients with gastric cancer.( 34 ) In the present study, we showed that Th2 shift was significantly observed in TILs in comparison to normal gastric mucosa; however, there was no significant difference in Th1/Th2 balances between early and advanced disease of gastric cancer. These results suggested that subsets of Th17/Treg might be affected more dynamically according to disease progression than Th1/Th2 balance.
In conclusion, the accumulation of Th17 cells as well as Treg in the tumor microenvironment occurred at an early stage of the disease and then the infiltration of Th17 cells gradually decreased according to disease progression, in contrast to increased Treg. A better understanding of the underlying mechanism regulating the Th17/Treg balance may lead to a novel therapeutic strategy for gastric cancer.
References
- 1. Sakuramoto S, Sasako M, Yamaguchi T et al. , ACTS‐GC Group Adjuvant chemotherapy for gastric cancer with S‐1, an oral fluoropyrimidine. N Engl J Med 2007; 357: 1810–20. [DOI] [PubMed] [Google Scholar]
- 2. MacDonald JS, Smalley SR, Benedetti J et al. Chemoradiotherapy after surgery compared with surgery alone for adenocarcinoma of the stomach or gastroesophageal junction. N Engl J Med, 2001; 345: 725–30. [DOI] [PubMed] [Google Scholar]
- 3. Lee HE, Chae SW, Lee YJ et al. Prognostic implications of type and density of tumour‐infiltrating lymphocytes in gastric cancer. Br J Cancer 2008; 99: 1704–11. [DOI] [PMC free article] [PubMed] [Google Scholar]
- 4. Naito Y, Saito K, Shiiba K et al. CD8+ T cells infiltrated within cancer cell nests as a prognostic factor in human colorectal cancer. Cancer Res 1998; 58: 3491–4. [PubMed] [Google Scholar]
- 5. Bettelli E, Carrier Y, Gao W et al. Reciprocal developmental pathways for the generation of pathogenic effector TH17 and regulatory T cells. Nature 2006; 441: 235–8. [DOI] [PubMed] [Google Scholar]
- 6. Korn T, Bettelli E, Oukka M, Kuchroo VK. IL‐17 and Th17 Cells. Annu Rev Immunol 2009; 27: 485–517. [DOI] [PubMed] [Google Scholar]
- 7. Dong C. Diversification of T‐helper‐cell lineages: finding the family root of IL‐17‐producing cells. Nat Rev Immunol 2006; 6: 329–33. [DOI] [PubMed] [Google Scholar]
- 8. Ivanov II, McKenzie BS, Zhou L et al. The orphan nuclear receptor RORgammat directs the differentiation program of proinflammatory IL‐17+ T helper cells. Cell 2006; 126: 1121–33. [DOI] [PubMed] [Google Scholar]
- 9. Yang XO, Pappu BP, Nurieva R et al. T helper 17 lineage differentiation is programmed by orphan nuclear receptors ROR alpha and ROR gamma. Immunity 2008; 28: 29–39. [DOI] [PMC free article] [PubMed] [Google Scholar]
- 10. Ouyang W, Kolls JK, Zheng Y. The biological functions of T helper 17 cell effector cytokines in inflammation. Immunity 2008; 28: 454–67. [DOI] [PMC free article] [PubMed] [Google Scholar]
- 11. Bettelli E, Oukka M, Kuchroo VK. T(H)‐17 cells in the circle of immunity and autoimmunity. Nat Immunol 2007; 8: 345–50. [DOI] [PubMed] [Google Scholar]
- 12. Zhang B, Rong G, Wei H et al. The prevalence of Th17 cells in patients with gastric cancer. Biochem Biophys Res Commun 2008; 374: 533–7. [DOI] [PubMed] [Google Scholar]
- 13. Kryczek I, Wei S, Zou L et al. Cutting edge: Th17 and regulatory T cell dynamics and the regulation by IL‐2 in the tumor microenvironment. J Immunol 2007; 178: 6730–3. [DOI] [PubMed] [Google Scholar]
- 14. Kryczek I, Banerjee M, Cheng P et al. Phenotype, distribution, generation, functional and clinical relevance of Th17 cells in the human tumor environments. Blood 2009; 114: 1141–9. [DOI] [PMC free article] [PubMed] [Google Scholar]
- 15. Derhovanessian E, Adams V, Hähnel K et al. Pretreatment frequency of circulating IL‐17(+)CD4(+) T‐cells, but not Tregs, correlates with clinical response to whole‐cell vaccination in prostate cancer patients. Int J Cancer 2009; 125: 1372–9. [DOI] [PubMed] [Google Scholar]
- 16. Sakaguchi S, Ono M, Setoguchi R et al. Foxp3+CD25+CD4+ natural regulatory T cells in dominant self‐tolerance and autoimmune disease. Immunol Rev 2006; 212: 8–27. [DOI] [PubMed] [Google Scholar]
- 17. Feuerer M, Hill JA, Mathis D, Benoist C. Foxp3+ regulatory T cells: differentiation, specification, subphenotypes. Nat Immunol 2009; 10: 689–95. [DOI] [PubMed] [Google Scholar]
- 18. Ichihara F, Kono K, Takahashi A, Kawaida H, Sugai H, Fujii H. Increased populations of regulatory T cells in peripheral blood and tumor‐infiltrating lymphocytes in patient with gastric and esophageal cancers. Clin Cancer Res 2003; 9: 4404–8. [PubMed] [Google Scholar]
- 19. Wolf D, Wolf AM, Rumpold H et al. The expression of the regulatory T cells‐specific forkhead box transcription factor FoxP3 is associated with poor prognosis in ovarian cancer. Clin Cancer Res 2005; 11: 8326–31. [DOI] [PubMed] [Google Scholar]
- 20. Curiel TJ, Coukos G, Zou L et al. Specific recruitment of regulatory T cells in ovarian carcinoma fosters immune privilege and predicts reduced survival. Nat Med 2004; 10: 942–9. [DOI] [PubMed] [Google Scholar]
- 21. Mizukami Y, Kono K, Kawaguchi Y et al. CCL17 and CCL22 chemokines within tumor microenvironment are related to accumulation of Foxp3+ regulatory T cells in gastric cancer. Int J Cancer 2008; 122: 2286–93. [DOI] [PubMed] [Google Scholar]
- 22. Afzali B, Lombardi G, Lechler RI, Lord GM. The role of T helper 17 (Th17) and regulatory T cells (Treg) in human organ transplantation and autoimmune disease. Clin Exp Immunol 2007; 148: 32–46. [DOI] [PMC free article] [PubMed] [Google Scholar]
- 23. Japanese Gastric Cancer Associations . Japanese classification of gastric carcinoma, 2nd (English Edn). Gastric Cancer 1998; 1: 10–24. [DOI] [PubMed] [Google Scholar]
- 24. Sfanos KS, Bruno TC, Maris CH et al. Phenotypic analysis of prostate‐infiltrating lymphocytes reveals TH17 and Treg skewing. Clin Cancer Res 2008; 14: 3254–61. [DOI] [PMC free article] [PubMed] [Google Scholar]
- 25. Dhodapkar KM, Barbuto S, Matthews P et al. Dendritic cells mediate the induction of polyfunctional human IL17‐producing cells (Th17‐1 cells) enriched in the bone marrow of patients with myeloma. Blood 2008; 112: 2878–85. [DOI] [PMC free article] [PubMed] [Google Scholar]
- 26. Inozume T, Hanada K, Wang QJ, Yang JC. IL‐17 secreted by tumor reactive T cells induces IL‐8 release by human renal cancer cells. J Immunother 2009; 32: 109–17. [DOI] [PMC free article] [PubMed] [Google Scholar]
- 27. De Marzo AM, Platz EA, Sutcliffe S et al. Inflammation in prostate carcinogenesis. Nat Rev Cancer 2007; 7: 256–69. [DOI] [PMC free article] [PubMed] [Google Scholar]
- 28. Caruso R, Fina D, Paoluzi OA et al. IL‐23‐mediated regulation of IL‐17 production in Helicobacter pylori‐infected gastric mucosa. Eur J Immunol 2008; 38: 470–8. [DOI] [PubMed] [Google Scholar]
- 29. Wilson NJ, Boniface K, Chan JR et al. Development, cytokine profile and function of human interleukin 17‐producing helper T cells. Nat Immunol 2007; 8: 950–7. [DOI] [PubMed] [Google Scholar]
- 30. Acosta‐Rodriguez EV, Napolitani G, Lanzavecchia A, Sallusto F. Interleukins 1beta and 6 but not transforming growth factor‐beta are essential for the differentiation of interleukin 17‐producing human T helper cells. Nat Immunol 2007; 8: 942–9. [DOI] [PubMed] [Google Scholar]
- 31. Fina D, Sarra M, Fantini MC et al. Regulation of gut inflammation and th17 cell response by interleukin‐21. Gastroenterol 2008; 134: 1038–48. [DOI] [PubMed] [Google Scholar]
- 32. Su X, Ye J, Hsueh EC, Zhang Y, Hoft DF, Peng G. Tumor microenvironments direct the recruitment and expansion of human Th17 cells. J Immunol 2010; 184: 1630–41. [DOI] [PubMed] [Google Scholar]
- 33. Mizukami Y, Kono K, Kawaguchi Y et al. Localisation pattern of Foxp3+ regulatory T cells is associated with clinical behaviour in gastric cancer. Br J Cancer 2008; 98: 148–53. [DOI] [PMC free article] [PubMed] [Google Scholar]
- 34. Wang SK, Zhu HF, He BS et al. CagA+ H pylori infection is associated with polarization of T helper cell immune responses in gastric carcinogenesis. World J Gastroenterol 2007; 13: 2923–31. [DOI] [PMC free article] [PubMed] [Google Scholar]