



Abstract
The immunosuppressive environment of malignant gliomas is likely to suppress the anti-tumor activity of infiltrating microglial cells and lymphocytes. Macrophages and microglial cells may be activated by oligonucleotides containing unmethylated CpG-motifs, although their value in cancer immunotherapy has remained controversial. Following injection of CpG-containing oligonucleotides (ODN) into normal rat brain, we observed a local inflammatory response with CD8+ T cell infiltration, upregulation of MHC 2, and ED1 expression proving the immunogenic capacity of the CpG-ODN used. This was not observed with a control ODN mutated in the immunostimulatory sequence (m-CpG). To study their effect in a syngeneic tumor model, we implanted rat 9L gliosarcoma cells into the striatum of Fisher 344 rats. After 3 days, immunostimulatory CpG-ODN, control m-CpG-ODN, or saline was injected stereotactically into the tumors (day 3 group). In another group of animals (day 0 group), CpG-ODN were mixed with 9L cells prior to implantation without further treatment on day 3. After 3 weeks, the animals were killed and the brains and spleens were removed. Rather unexpectedly, the tumors in several of the animals treated with CpG-ODN (both day 0 and day 3 group) were larger than in saline or m-CpG-ODN treated control animals. The tumor size in CpG-ODN-treated animals was more variable than in both control groups. This was associated with inflammatory responses and necrosis which was observed in most tumors following CpG treatment. This, however, did not prevent excessive growth of solid tumor masses in the CpG-treated animals similar to the control-treated animals. Dense infiltration with microglial cells resembling ramified microglia was observed within the solid tumor masses of control- and CpG-treated animals. In necrotic areas (phagocytic), activation of microglial cells was suggested by ED1 expression and a more macrophage-like morphology. Dense lymphocytic infiltrates consisting predominantly of CD8+ T cells and fewer NK cells were detected in all tumors including the control-treated animals. Expression of perforin serving as a marker for T cell or NK cell activation was detected only on isolated cells in all treatment groups. Tumors of all treatment groups revealed CD25 expression indicating T cells presumed to maintain peripheral tolerance to self-antigens. Cytotoxic T cell assays with in vitro restimulated lymphocytes (51chromium release assay) as well as interferon-gamma production by fresh splenocytes (Elispot assay) revealed specific responses to 9L cells but not another syngeneic cell line (MADB 106 adenocarcinoma). Surprisingly, the lysis rates with lymphocytes from CpG-ODN-treated animals were lower compared to control-treated animals. The tumor size of individual animals did not correlate with the response in both immune assays. Taken together, our data support the immunostimulatory capacity of CpG-ODN in normal brain. However, intratumoral application proved ineffective in a rat glioma model. CpG-ODN treatment may not yield beneficial effects in glioma patients.
Keywords: CpG, Glioma, Rat, Oligonucleotides, Stereotactic
Introduction
Tumor cell dissemination beyond the margins of resection and resistance to conventional adjuvant therapies lead to the inevitable recurrence of malignant gliomas. This results in the incurability of this disease, and despite enormous research efforts the extremely poor survival rates have not increased substantially over several decades.
In principle, the immune system may be apt to trace and destroy the diffusely infiltrating tumor cells. Dense lymphocytic and microglial infiltrates have been observed in brain tumors indicating that they are recognized by the immune system [7, 10, 16, 32]. On the other hand, malignant brain tumors are renowned for their immunosuppressive capacity and effective immunosuppression is regarded crucial for tumor maintenance and growth.
In a rat glioma model we observed that DNA vaccination against a model antigen (E. coli lacZ) resulted in a significant decrease in tumor size [15]. Nonetheless, complete protection from intracerebral tumor formation was not observed even after the addition of interleukin-12 or flt3 ligand to the vaccine. Immunohistochemical staining revealed dense infiltrates with microglial cells which rather support tumor growth than being involved in tumor destruction [16, 32]. In order to activate microglial cells and augment the anti-tumor effects of DNA vaccination we administered immunostimulatory CpG-oligonucleotides (CpG-ODN) resembling bacterial DNA sequences [23, 29]. Rather unexpectedly, intratumoral application of CpG-ODN did not elicit adjuvant anti-tumor effects in conjunction with DNA vaccination. Instead, we observed an increase in tumor size. Since intratumoral CpG-ODN administration is pursued in clinical trials [6, 22, 23], we studied their sole effect in the syngeneic rat gliosarcoma model (9L) in Fisher 344 rats.
Materials and methods
Cell lines and in vitro cell proliferation
9L rat gliosarcoma cells (obtained from the Brain Tumor Research Center, University of California, San Francisco, USA) and MADB 106 rat adenocarcinoma cells (kindly provided by Dr. Thomas von Hörsten, Medizinische Hochschule Hannover, Germany) were cultured in DMEM (9L) or RPMI (MADB 106; both cell culture media obtained from GIBCO BRL Life Technologies, Karlsruhe, Germany) containing 10% heat-inactivated fetal calf serum and antibiotics (penicillin/streptomycin, Sigma-Aldrich, St. Louis, MO, USA) at 37°C in a humid atmosphere with 5% CO2. Both cell lines are syngeneic to Fisher 344 rats. To assess the effects of immunostimulatory oligonucleotides (ODN) on tumor cell growth in culture, 9L cells grown in 96 wells (2,000 cells per well) were incubated with two different concentrations of ODN (10−5 and 10−6 M) containing immunostimulatory CpG-motifs (5′-TGACTGTGAACGTTCGAGATGA-3′) or ODN mutated in the CpG-motif (m-CpG-ODN; 5′-TGACTGTGAAGGTTAGAGATGA-3′) [8, 27]. The oligonucleotides were synthesized with a phosphorothioate backbone to increase their stability [18] and purchased from Proligo (Paris, France). Viable cells were counted by standard trypan blue staining after 2 and 4 days.
Tumor cell implantation and inoculation of oligonucleotides into 9L tumors and normal rat brain
Male Fisher 344 rats (250–275 g; Charles River, Sulzfeld, Germany) were housed according to German Animal Protection Regulations and permission had been obtained for these experiments. For ODN or tumor cell implantation, animals were anesthetized with 4% chloral hydrate (1 ml per 100 g). Heads were fixed in a stereotactic frame (TSE Systems, Michigan, MI, USA) and a burr hole was placed 2 mm lateral and 2 mm anterior to the bregma.
To assess the effects of ODN in normal brain, the immunostimulatory CpG-ODN (50 μg/3 μl isotonic saline) were injected into the brain of tumor-free Fisher rats (implantation procedure described below). In each animal the contralateral striatum was injected with the same amount of ODN containing a mutation in the CpG-motif (m-CpG; the CpG- and mCpG-ODN sequences are identical to those described above). Animals were killed at 2, 5 and 8 days after injection and the brains were removed for immunohistochemistry as described below.
To investigate the effects of ODN treatment on 9L tumor growth in vivo, 5 × 10⁴ 9L cells suspended in 5 μl DMEM without supplements were slowly injected into the right striatum with a 10 μl Hamilton syringe. The needle was carefully retracted and the burr hole was sealed with bone wax. Treatment with ODN (50 μg CpG/4 μl saline) was performed on day 3 following tumor cell implantation except for a group of animals in which the cell suspension was mixed with the CpG-ODN prior to tumor cell inoculation. The latter group of animals received no further treatment on day 3. The intratumoral injections of CpG- or m-CpG-ODN or saline (vehicle control) were performed in anesthesia with the same stereotactic coordinates used previously for tumor cell implantation.
After 3 weeks, animals were anesthetized with diethylether and a lethal dose of chloral hydrate. Spleens were removed under sterile conditions and kept in ice-cold RPMI containing 10% FCS until lymphocyte preparation. Blood was collected from the right atrium, and brains were removed without prior fixation and transferred in anti-freeze medium, shock-frozen in liquid nitrogen, and stored at −20°C.
Histology and immunohistochemistry
Hemalaun–eosin (HE)-stained sections (10 μm) were cut in intervals of 200 μm with a cryostat 2800 Frigocut (Reichert-Jung, Nußloch, Germany). Tumor volume was calculated with the following formula for an rotation ellipsoid: V = 4/3 × π × 0.125 (length × height × width). For immunohistochemistry and X-gal staining, brain slices from non-fixed brains were mounted on coated slides (Marienfeld GmbH, Lauda-Königshofen, Germany), air-dried, and stored at −20°C in aluminum foil.
Staining was performed according to Barclay et al. [4]. In brief, slices were fixed in acetone at −20°C for 10 min and rinsed in tap water for 1 min. To eliminate endogenous peroxidase activity, slices were transferred in PBS/methanol (1:1) containing 0.3% H2O2 and washed thrice with PBS. Immunohistochemistry was performed with the following mouse anti-rat monoclonal antibodies (obtained from Serotec, Oxford, UK; all antibodies were diluted 1:400): W3/25 (CD4), MRC OX-8 (CD8), MRC OX-39 (CD25), R73 (T cell receptor alpha and beta), 10/78 (NKR-P1), and ED1 (CD68). In addition, the following rabbit anti-rat polyclonal antibodies were used: anti-perforin (Torrey Pine Biolabs, San Diego, CA; dilution 1:400) and Iba1 directed against an ionized calcium-binding adaptor molecule-1 expressed in microglia and macrophages (kind gift from Y. Imai, Department of Neurochemistry, National Institute of Neuroscience, Tokyo; dilution 1:1,500). Incubation with primary antibodies in PBS with 1% bovine serum albumin was performed at 4°C overnight. Slices were washed three times with PBS, and the secondary biotinylated rabbit anti-mouse or swine anti-rabbit antibody (Dako, Hamburg, Germany; diluted 1:400 in PBS with 10% heat-inactivated rat serum) was added at 37°C for 1 h. After incubation for 45 min at 37°C with a streptavidin-complex (Dako, Hamburg, Germany), slices were stained with the chromogene substrate diaminobenzidine (DAB) (Dako, Hamburg, Germany) followed by nuclear staining with hemalaun.
Cytotoxic T lymphocyte assay
Spleens removed under sterile conditions were minced in a Petri dish and passed through a 70 μm pore filter (Becton–Dickinson Labware, Franklin Lakes, NJ, USA). This suspension was layered onto Lympholyte M (Fa. Cedar Lane, Ontario, Canada) and separated by density-gradient centrifugation at 2,500 U/min for 20 min. The phase above the lympholyte consisting of mononuclear cells was removed and washed thrice with RPMI without supplement. This cell suspension was transferred to a Petri dish and the cells were allowed to adhere to the bottom at 37°C for 2 h. In contrast to monocytes/macrophages and B cells, which all adhere to plastic T cells, which can be collected by aspiration off the culture media after gentle shaking [33]. Cells were washed twice with RPMI containing 10% FCS and 100 U/ml penicillin/100 μg/ml streptomycin and counted. Usually 1–2 × 10⁸ mononuclear cells per spleen were obtained.
Generation of CTL was performed according to Steinmann et al. [31]. In brief, 9L cells serving as stimulator cells were seeded in 6-well plates and irradiated with a lethal dose of 40 Gy. T cell-enriched mononuclear cells (5 × 10⁶) were added at a ratio of 1:10 which proved optimal in preliminary experiments and co-cultures were incubated for 7 days. On days 3 and 5, fresh RPMI (with 10% FCS and penicillin G/streptomycin) containing 30 U/ml human recombinant Il-2 (Sigma-Aldrich, St. Louis, MO, USA) was added.
On day 7, the target cells (TC) (5 × 10⁵) were labeled with 200 μCi Na51CrO4 (Amersham-Buchler, Braunschweig, Germany) in 1 ml RPMI containing 10% FCS in a shaking water bath at 37°C for 1 h. Labeled TC (9L or MADB 106) were washed thrice to eliminate non-incorporated Na51CrO4 and their viability was determined by trypan blue exclusion. Cell viability was >90% in all experiments. TC (3,000 cells/well) were distributed in 96-well round-bottom plates (Corning Incorporated, Corning, NY, USA) in RPMI containing 10% FCS and centrifuged to the bottom at 1,000 U/min for 1 min. Cells were let to adhere for 2–3 h before effector cells (EC) were added. These were collected, counted, and added in triplicates to labeled cells in fresh RPMI medium in different ratios (10:1, 20:1, 40:1, 80:1). The plates were centrifuged for 3 min to assure a close contact between TC and EC. Plates were incubated at 37°C for 4 h. The radioactive supernatant was harvested with a harvesting system (Scatron, Suffolk, UK) and transferred to a Gamma counter (Fa. Canberra-Packard, Frankfurt, Germany). Spontaneous release of 51Cr was determined from six wells devoid of EC (equivalent to 0% specific release). Maximum (100%) release of 51Cr was determined after incubation of six wells with 10% Triton-X detergent. Specific lysis was calculated as follows:
 |
Intracellular IFN-γ synthesis (Elispot assay)
Intracellular IFN-γ synthesis was determined with a commercially available Elispot kit (Diaclone, Besançon, France) following the provided protocol with minor modifications according to Heiser et al. [19]. In brief, PVDF-96-well plates were incubated with an anti-rat IFN-γ antibody (capture antibody) at 4°C overnight. The next day, freshly isolated spleen cells (5 × 10⁵ responder cells per well) were washed and resuspended in RPMI containing 10% FCS. These cells were co-incubated with 9L or MADB106 (105 stimulator cells per well) in the IFN-γ antibody precoated 96-well plates. After incubation at 37°C for 20 h, a biotinylated anti-rat IFN-γ antibody (detection antibody) was added and detected with streptavidin-conjugated alkaline phosphatase converting the substrate BCIP/NBT to a blue dye. Dots were counted with the Bioreader®-System (BIO-SYS GmbH, Karben, Germany).
Statistical analysis
For multiple group comparisons, ANOVA was performed followed by the Student–Newman–Keuls test for between-group analysis.
Results
The immunostimulatory activity of CpG-ODN was assessed first in the brain of tumor-free rats. Oligonucleotides mutated in the immunostimulatory CpG-motif (m-CpG) were injected into the contralateral hemisphere serving as an internal control (Fig. 1). After 2 days, the CpG-treated hemispheres revealed focal staining for ED1 at the injection site as well as in the leptomeninges (Fig. 1a). ED1 staining was even more pronounced when investigated after 5 days (Fig. 1b). No such ED1 induction was observed with m-CpG-ODN (Fig. 1a, b). Similarly, CpG but not m-CpG treatment resulted in MHC 2 induction 5 days after ODN administration (Fig. 1d, f). The morphology of the MHC 2 positive cells resembled microglial cells. After CpG treatment, CD8+ cells could also be detected, predominantly in the vicinity of vessels forming perivascular cuffs (Fig. 1e). These cells may represent microglia, macrophages, or lymphocytes [21]. As described for ED1, CD8+ and MHC 2 positive cells were also found in the leptomeninges of the CpG-ODN-treated hemisphere (Fig. 1g, h).
Fig. 1.

Effect of immunostimulatory CpG-ODN or CpG-ODN mutated in the immunostimulatory sequence (m-CpG) in normal rat brain. a After 2 days, focal staining for ED1 was observed at the injection site and in the leptomeninges (magnified in the inserted image) of the CpG-ODN-treated hemisphere. b After 5 days, ED1 staining at the inoculation site is more pronounced (the ED1 positive area is magnified in the inserted image). Similarly, CpG-ODN (d, f) but not mCpG-ODN (c) treatment resulted in MHC 2 induction 5 days after ODN administration. Magnification revealed MHC 2 positive microglial cells or macrophages (f) and perivascular inflammation with CD8 positive cells representing microglia, macrophages, or lymphocytes (e). Similarly, in the leptomeninges of the CpG-ODN-treated hemisphere CD8 positive (g) and MHC 2 positive (h) cells were detected
Prior to intracerebral tumor cell inoculation, we investigated direct effects of ODN treatment on tumor cell growth in culture. CpG-ODN added at concentrations of 10−6 M as well as m-CpG-ODN (10−5 and 10−6 M) inhibited exponential growth of 9L cells (Fig. 2). CpG-ODN administered at higher concentrations (10−5 M) resulted in a slight decrease in viable cells indicating cytotoxic effects (Fig. 2).
Fig. 2.

Effect of CpG-ODN on 9L cells grown in culture. Although exponential cell proliferation was observed in vehicle-treated cultures, the addition of CpG-ODN (10−6 M) and CpG-ODN mutated in the immunostimulatory sequence (m-CpG; 10−6 M) resulted in growth inhibition. A decrease in cell numbers indicating cytotoxicity was observed with CpG-ODN when added at a concentration of 10−5 M
The effect of intratumoral CpG-ODN treatment on tumor size was determined 3 weeks after intracerebral implantation of rat 9L cells. Treatment with the mutated ODN (m-CpG-ODN) resulted in tumors similar in size to the saline-treated controls. Rather surprisingly, CpG-ODN (applied both on day 3 or day 0) led to a higher variability in tumor size, and several CpG-treated animals revealed tumors exceeding the largest tumors in both control groups (Fig. 3). The overall difference between all treatment groups, however, did not prove statistically significant (ANOVA; p > 0.05). One animal in the group having received the CpG-ODN together with the tumor cell suspension on day 0 had died prior to killing. At autopsy excessive tumor growth with a tumor diameter of >10 mm representing the likely cause of death was found. Since the tumor volume could not be determined with accuracy, this animal had to be excluded from further analysis.
Fig. 3.

Effect of intratumoral CpG-ODN treatment on tumor volumes 3 weeks after intracerebral implantation of rat 9L cells. On day 3 after tumor cell implantation, intratumoral injections were performed with saline (control), a control oligonucleotide mutated in the immunostimulatory sequence (m-CpG), or a CpG-containing immunostimulatory ODN (CpG). In treatment group ‘CpG (day 0)’, the 9L cells were mixed with immunostimulatory CpG-ODN prior to tumor cell inoculation to simulate an optimal distribution of CpG-ODN within the tumor. These animals received no additional CpG treatment on day 3. In this group, one animal had died prior to killing because of excessive tumor growth (not included). No statistically significant differences were detected between the treatment groups (p > 0.05; ANOVA). The letters on top of the bars indicate the plot in Fig. 5 depicting the CTL response of the same animal, e.g., the CTL response of the saline-treated animal labeled with an a is shown in panel a of Fig. 5
All tumors were investigated by standard HE histology and immunohistochemistry (Fig. 4). In the majority of the CpG-treated tumors histology revealed more abundant necrosis which contributed to the higher variation in tumor size in the CpG-ODN-treated animals compared to controls (Fig. 4l, m). In the saline-treated control animals only small areas of necrosis were observed. Although the necrotic areas contributed to the increase in tumor size in some of the CpG-treated animals, most of the tumors consisted of a solid tumor mass. Notably, tumor morphology was not different between animals which had received intratumoral CpG injections (day 3) or tumor cell suspensions mixed with CpG-ODN (day 0).
Fig. 4.

Immunohistochemical staining of tumor sections following intratumoral application of CpG-ODN (CpG) or saline (control). a–e the same region revealing the tumor margin and the adjacent normal brain was stained. In particular, in perivascular areas, dense infiltrates with TCR+ cells (a) were observed which consisted predominantly of CD8+ lymphocytes (c). The tumors contained numerous CD25 positive cells indicating CD4+ (or CD8+) regulatory T cells implicated in peripheral tolerance to self-antigen (d). The same region also contained NK cells which were less abundant (e). Perforin serving as a marker for cytotoxic effector activity of NK and CD8+ cells was only detected on few cells within CpG- and saline-treated (f) tumors. Staining for CD4 revealed dense infiltrates (b) consisting of lymphocytes and microglia. More specific staining (Iba1 and ED1) distinguished two types of microglial cells (g–q). In particular, around necrotic areas which were more prevalent in CpG-treated tumors, patchy areas were found revealing cells which resembled macrophages and which showed strong expression of ED1, a marker for phagocytic activity (l, m, p, q). To a lesser extent, focal expression of ED1 was also observed in saline-treated control animals (j, k). An abundance of more evenly distributed microglial cells with a ramified morphology was found within the tumors and peritumoral brain parenchyma (g, h, n, o). Such ramified microglia was predominant in the non-necrotic areas of both control-treated or CpG-treated animals
Both in CpG-treated and control-treated animals, dense infiltrations with lymphocytes could be observed, in particular, in perivascular areas (Fig. 4a; T cell receptor). Most of these cells were CD8+ T cells and only few NK cells could be detected (Fig. 5c, e). CD4 staining revealed both lymphocytes and microglial cells [26] (Fig. 4b). Irrespective of prior CpG treatment only few cells stained positive for perforin serving as a marker for T cell or NK cell activation (Fig. 4f). Lymphocytes staining positive for CD25 were detected throughout the tumors of all treatment groups indicating T cells playing a role in the maintenance of tolerance to self-antigens. The extent of lymphocytic infiltration within individual tumors showed regional heterogeneity (e.g., perivascular accumulation) and we observed some variation between animals of the same treatment group. Notably, the treatment groups could not be distinguished based on a characteristic lymphocytic staining pattern except for the presence of necrotic areas which were more prevalent in the CpG-treated animals.
Fig. 5.
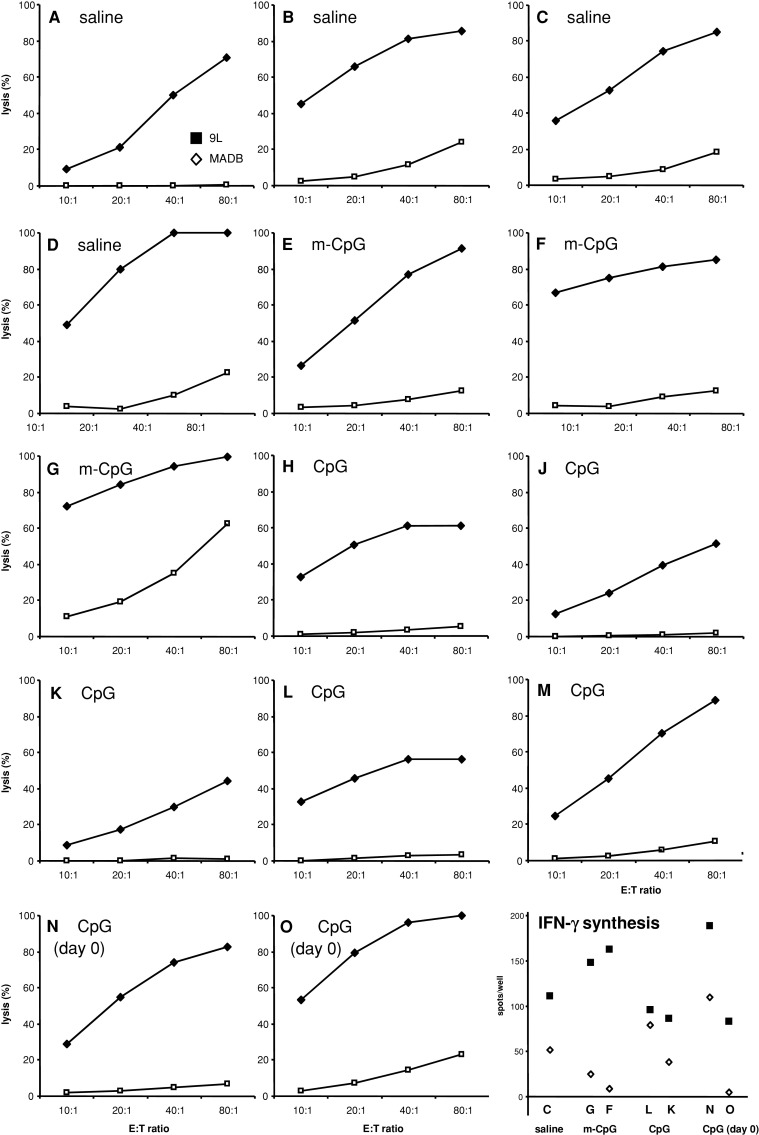
Cytotoxic T cell responses assessed by 51chromium release (a–l) and IFN-γ synthesis quantified by the ELISPOT assay (m). a–l 51Cr release lymphocytes were restimulated with 9L cells for 1 week and added to 51Cr-labeled 9L target cells or another syngeneic adenocarcinoma cell line (MADB 106) in different effector to target ratios (E:T ratio). In all animals (a–l), specific lysis was observed with 9L cells but not with syngeneic MADB 106 cells. In both control groups (saline, a–d, and m-CpG, e–g), high lysis rates (>80–90%) were detected. In CpG-treated animals similar levels were measured following CpG-ODN treatment on day 0 concomitant with tumor cell grafting (n, o). Rather surprisingly, intratumoral application of immunostimulatory CpG-ODN 3 days after tumor cell grafting resulted in markedly lower lysis rates in 4 of 5 animals (h–m). IFN-γ synthesis in freshly isolated splenocytes following exposure to 9L cells or syngeneic MADB 106 cells was determined by Elispot assays. The letters on the x-axis indicate the panel showing the 51chromium release response of the same animal. For example, “c” corresponds to panel c depicting the CTL response of the same animal. This represents a saline-treated animal, and the tumor volume measured in the same animal can be determined from Fig. 3. IFN-γ synthesis was observed in all treatment groups following exposure to 9L cells. Reduced levels of IFN-γ synthesis were observed upon stimulation with the syngeneic rat adenocarcinoma cell line MADB 106 suggesting a 9L specific response. In most animals (c, f, g, k, l, n, o) the amount of IFN-γ synthesis detected was similar to the CTL response obtained after restimulation of lymphocytes in culture
The tumors of all treatment groups were densely infiltrated with microglial cells. Two types of microglial cells could be distinguished. Microglia resembling macrophages and with high expression of ED1 (regarded as a marker for phagocytic activity) but also Iba1 staining was predominantly found in the CpG-treated animals, in particular, in the vicinity of necrotic areas observed predominantly in this treatment group (Fig. 4l, m, p, q). However, focal ED1 expression was also seen in some of the control-treated animals (Fig. 4j). Microglial cells of the ramified phenotype were detected by staining for MHC 2 or Iba1 and occurred as dense and rather evenly distributed cell population within the solid, non-necrotic tumor masses as well as the peritumoral brain parenchyma of control but also CpG-treated animals (Fig. 4g, h, n, o).
To assess the induction of cytotoxic T cell responses directed against the implanted 9L tumor cells, cytotoxic lymphocytes were generated from in vitro restimulated spleen cell preparations. Specific lysis of >25% was observed with 9L cells but not with another syngeneic adenocarcinoma cell line (MADB 106) serving as target cells (Fig. 5a–o). Lymphocyte preparations from naive rats which had not been implanted with 9L cells did not lyse syngeneic 51Cr-labeled 9L or MADB 106 target cells (lysis <5%; not shown). Rather unexpectedly, more effective lysis was observed with lymphocytes generated from control-treated animals. Although high lysis rates (>80–90%) could be observed with effector cells from saline (Fig. 5a–d) and m-CpG-treated animals (Fig. 5e–g), four of five animals treated by intratumoral CpG injections (day 3) revealed markedly reduced lysis rates (Fig. 5h–m). This, however, was not observed with effector cells derived from two animals treated with CpG-ODN on day 0 in conjunction with tumor grafting (Fig. 5n, o). In these animals, lysis rates were achieved similar to both control groups (saline and m-CpG). The tumor volumes of all the animals studied by CTL analysis are indicated in Fig. 3, e.g., the CTL response depicted in Fig. 5 panel A refers to the tumor volume of animal “a” as indicated on top of the bar graph in Fig. 3. The CTL response of individual animals did not reflect the size of the tumors.
To further assess Th1-related lymphocytic reactivity, Elispot assays were performed with splenocytes from a few of the animals selected for 51chromium release assays (Fig. 5) IFN-γ synthesis. The letters on the x-axis refer to the corresponding CTL plot of the same animal, e.g., “c” refers to a saline-treated control animal for which the CTL response is indicated in panel C and for which the tumor size can be derived from Fig. 3. Exposure of freshly isolated spleen cells to 9L cells induced specific IFN-γ synthesis in all treatment groups. IFN-γ production appeared specific for 9L cells since lower levels of IFN-γ were detected upon stimulation with the syngeneic rat adenocarcinoma cell line MADB 106. In most animals, the amount of IFN-γ measured compared well to the lysis rates detected in CTL assays performed with lymphocytes which had been restimulated in culture for 1 week (Fig. 5). In one animal lower levels of IFN-γ were detected, although the CTL assay revealed a strong cytotoxic response (Fig. 5, animal “o”). Two animals treated intratumorally with CpG-ODN on day 3 were investigated with both assays (Fig. 5, animal “l” and “k”). Both assays do not suggest an immunostimulatory effect of this treatment since both the CTL response and the amount of IFN-γ synthesized were lower than in the control-treated animals.
Discussion
Despite clear immunostimulatory effects elicited by CpG-ODN in normal rat brain, intratumoral CpG treatment did not inhibit the formation of syngeneic gliomas. The tumor size in the CpG-treated groups was more variable and most of the CpG-treated tumors were larger than control-treated tumors. Although inflammatory responses associated with necrosis contributed to this increase in tumor size, most of the tumors consisted of solid masses similar to the control-treated animals. This was observed both in animals injected with CpG-ODN 3 days after tumor cell implantation and in animals having receiving tumor cells mixed with CpG-ODN prior to grafting. Thus, inhomogenous distribution of the CpG-ODN injected on day 3 possibly causing necrosis in CpG-spilled areas and tumor growth in regions not exposed to the ODN is unlikely.
Since tumor size was assessed 3 weeks after grafting, it remains unresolved whether some of the tumors had shrinked or even disappeared after longer observation periods. Increased survival has been reported after intratumoral CpG treatment in a similar intracranial model using CNS-1 glioma cells in Lewis rats as well as the murine GL261 glioma model [8, 12, 17]. With 9L gliosarcoma cells, Auf et al. [1] observed reduced tumor growth in a subcutaneous model in Fischer rats after repetitive intratumoral CpG injections. It has not been mentioned whether repetitive administration was required for successful treatment in this subcutaneous 9L model since repetitive administration was not applied in other studies of this laboratory. We seeked the permission to investigate animal survival which, however, could not been obtained from the local authorities and could not be investigated. During killing, we observed excessive tumor growth in most animals resulting in general slowing and moderate weight loss. This argues against the speculation that tumor rejections had possibly occurred with longer observation periods. In fact, killing at later stage had to be regarded unethical in several animals, and one of the animals having received the optimized treatment (CpG-ODN mixed homogeneously with the tumor cells before grafting) died from excessive tumor growth before killing.
Our findings are supported by other studies reporting inconsistent anti-tumor effects following CpG-ODN administration. CpG-ODN treatment had differential effects in normal brain and in tumors on the baseline expression and induction of MHC 2 and of co-stimulatory molecules, such as B7.1 and B7.2 [2, 29]. Furthermore, differences have been observed between different brain tumor models. Interestingly, in their discussion Schartner et al. [29] mentioned that they were not able to detect inhibition of tumor growth or extended survival in intracranial RG2 rat gliomas treated intratumorally with CpG-ODN. One explanation is that the therapeutic effects depend on the tumor model studied. On the other hand, the actual immune responses may vary within the same tumor model due to factors which cannot be easily controlled. For example, it is almost impracticable to rule out changes in the immunogenicity of cell lines which could arise during routine maintenance in culture. In addition, the immunological capabilities of the same inbred rat strain may vary between different animal cohorts purchased or bred at an institution.
The immunostimulatory CpG-ODN did not induce proliferation of tumor cells in cell culture arguing against direct promotion of tumor growth. We rather observed dose-dependent cytotoxic effects of CpG-ODN which, however, were moderate because only slowing of exponential cell proliferation or slight cytotoxicity in higher concentrations was detected. Although human and rodent glioma cell lines have been reported to express Toll-like receptor 9 [12] such expression had not been detected in 9L cells [24] arguing in favor of other (unspecific) mechanisms mediating this moderate cytotoxicity. Although the in vivo relevance of these cytotoxic effects is unclear, it appears more likely that this inhibits tumor growth and this does not explain an increase in tumor size as observed in several of our CpG-treated animals. Since necrotic areas had been observed in some of the large CpG-ODN-treated tumors, one may speculate that this reflects direct cytotoxic effects of CpG-ODN at the site of injection. This, however, is unlikely since necrosis had not been observed in normal brain treated with the same amount of CpG-ODN. Thus, necrosis rather reflects the excessive tumor growth observed in some of the CpG-ODN-treated animals or late inflammatory responses induced by CpG-ODN.
Treatment of tumors with CpG-ODN has been shown to promote invasion [20, 25]. In principle, CpG-ODN at the time of their administration may have induced 9L tumor cell infiltration. Although we did not observe increased tumor cell infiltration in CpG-ODN-treated animals, early tumor cell dissemination upon CpG-ODN administration may have occurred and promoted tumor growth. Nonetheless, this is unlikely since CpG-ODN-induced invasion is dependent on TLR9 [20, 25] which is not expressed by 9L cells.
In normal rat brains we observed clear and widespread activation of microglial cells (ED1 and MHC 2 staining) following CpG-ODN treatment proving that the CpG-ODN sequence and the batch of CpG-ODN employed is bioactive. This was evident after 2 days with a further increase after 5 days. The immune responses were specific for the CpG-ODN since no such activation was observed in the contralateral hemispheres injected with a mutated CpG-ODN. CD8 staining was most pronounced in perivascular areas. These cells may represent not only lymphocytes but also a population of microglia or macrophages accumulating early in CNS lesions, as described following ischemia [21].
In tumor-bearing animals, all tumors showed strong MHC 2 and Iba1 expression in and around the tumors indicating microglial cells. This staining was independent of prior CpG treatment and this is in agreement with the well-known prevalence of microglia in this glioma model [2]. Compared to control-treated animals (saline and m-CpG) in the CpG-treated tumors (phagocytic), activation of microglial cells was observed more frequently. In particular, in necrotic areas, we detected intense staining for ED1, a microglial activation marker found on lysosomal membranes and representing phagocytic activity [9]. However, ED1 was also detected in control-treated tumors, and, to a large extent, the overall increased ED1 expression in CpG-treated tumors (days 3 and 0) reflected the fact that necrotic areas were more prevalent in the CpG-group. Activation of microglial cells by CpG-ODN appears to be a transient and self-limiting process [30]. Thus, ED1 expression is unlikely to represent a direct consequence of CpG administration (as observed in normal brain) but rather reflects (phagocytic) microglial activity present at the day of killing, in particular, in necrotic areas. It cannot be ruled out that the necrotic areas indicate focal anti-tumor activity elicited by CpG-ODN. However, this effect was not strong enough to result in regression or even rejection of the tumors. Furthermore, all CpG-treated tumors (including those which had been treated with CpG-ODN on the day of tumor grafting) consisted of large, necrosis-free areas revealing solid tumor growth not distinguishable from control-treated rats.
In all tumors we observed dense infiltrates with T cells and NK cells representing a common feature of gliomas. However, the extent of T cell or NK cell infiltration and the activation status was not altered by CpG-ODN treatment. T cell and NK cell infiltrates varied more among different animals of the same treatment group (and within individual tumors, e.g., necrosis vs. areas of solid tumor growth) than between animals of different treatment groups. In particular, staining with perforin, a marker for cytolytic activity of NK cells and T cells, was restricted to single cells. Notably, the number of perforin-positive cells was not increased in the CpG-treated animals. This indicates that the lymphocytic infiltrates are rendered anergic or self-tolerant a phenomenon commonly observed in gliomas and thought to represent one of the obstacles for effective immunotherapy. This may be mediated by the numerous CD25 positive cells detected in all tumors. These cells are likely to represent CD4+ (or CD8+) regulatory T cells which have been implicated in the maintenance of peripheral tolerance to self-antigens [11, 14, 28]. Similar to what has been found in glioma patients, one should consider that rather than the absolute number the fraction of the CD25 positive cells among the CD4 positive T cell population may be relevant [13].
Quantification of lymphocytes is hampered by the fact that cells staining CD8 or CD4 positive may also represent microglia or macrophages [21]. With respect to the time point (3 weeks following CpG treatment) and their morphology, most of the CD8-positive cells are likely to represent lymphocytes. This differs from the early response to CpG treatment of normal brain revealing CD8-positive cells resembling microglia or macrophages (cf. Fig. 1; [21]). On the other hand, staining of the tumors for the CD4 antigen revealed a great amount of microglia or macrophages as suggested by cell morphology. This is in accordance with the occurrence of CD4 positive microglia or macrophages in a later phase after brain lesioning [21]. The microglia or macrophages detected in rodent and human gliomas amount to a significant portion of the tumor mass and meanwhile their tumor promoting and immunosuppressive character has been exposed [16, 32]. This is mediated by various mechanisms, e.g., by the production of immunosuppressive cytokines such as IL-10 and PGE-2 and by altering the cytokine environment shifting T helper cell responses from Th1 to Th2. In addition, T cells may be rendered anergic or apoptotic by FasL or other molecules expressed by microglia which has not been studied in our model [3].
Functional characterization of lymphocytes in CTL assays demonstrated that all animals exposed to 9L cells developed a strong cytolytic response to 9L cells reflecting the intrinsic immunogenicity of this model. Both CTL lysis and IFN-γ production appeared specific since it was restricted to stimulation with 9L cells and not observed with another syngeneic tumor cell line (MADB 106). This response occurred irrespective of prior treatment with immunostimulatory CpG-ODN, and rather surprisingly, the average lysis with lymphocytic effector cells generated from CpG-ODN-treated animals was lower than with effector cells derived from control-treated animals (saline and m-CpG). Although this apparent suppression of cytotoxic response has to remain unexplained, a similar response was observed in Elispot assays measuring IFN-γ synthesis in fresh splenocyte preparations exposed to 9L cells. This supports the conception that, at least in our model, intratumoral application of CpG-ODN may inhibit cytotoxic immune responses. It may even be speculated that this inhibitory response contributes to the formation of larger tumors as observed in some of the CpG-treated animals. However, the interpretation of these data is limited by the fact that even in the tumor models in which CpG-ODN have been used successfully the exact mechanisms have not been resolved. Although activation of microglia/macrophages appears to play a crucial role, B or T cells may only be involved at a later stage maintaining an anti-tumor response [1, 5].
Taken together, CpG-ODN with proven immunostimulatory activity in vivo (in normal rat brain) do not elicit reliable anti-tumor effects. Our data are in line with the well-known immunosuppressive features of gliomas and their resistance to all therapeutic approaches investigated to date. Despite the intrinsic immunogenicity of the 9L glioma model in which complete tumor rejection can be achieved, CpG-ODN were not sufficient to induce anti-tumor effects. This appears to reflect the systemic and local immunosuppressive features of gliomas going along with anergic or tolerant lymphocytes found within the tumors and an abundance of intratumoral microglial cells supposed to serve the purpose of the tumor rather than being involved in anti-tumor defense mechanisms [16, 32]. The clinical use of CpG-ODN may not increase the survival of glioma patients.
Acknowledgments
We are indebted to Dr. Axel Heiser for his support in performing the Elispot assays. We thank Dr. T. von Hörsten (Medizinische Hochschule Hannover, Germany) for supplying us with the MADB 106 adenocarcinoma cell line. The Iba1 antibody was a kind gift from Dr. Y. Imai (Department of Neurochemistry, National Institute of Neuroscience, Tokyo). The technical support by Mrs. Bärbel Hufnagel is appreciated. This work has been supported by the ‘Interdisziplinäres Zentrum für Krebsforschung der Christian-Albrechts Universität zu Kiel’ and by the ‘Hensel Stiftung’.
References
- 1.Auf G, Carpentier AF, Chen L, Le Clanche C, Delattre JY. Implication of macrophages in tumor rejection induced by CpG-oligodeoxynucleotides without antigen. Clin Cancer Res. 2001;7:3540–3543. [PubMed] [Google Scholar]
- 2.Badie B, Bartley B, Schartner J. Differential expression of MHC class II and B7 costimulatory molecules by microglia in rodent gliomas. J Neuroimmunol. 2002;133:39–45. doi: 10.1016/S0165-5728(02)00350-8. [DOI] [PubMed] [Google Scholar]
- 3.Badie B, Schartner J, Prabakaran S, Paul J, Vorpahl J. Expression of Fas ligand by microglia: possible role in glioma immune evasion. J Neuroimmunol. 2001;120:19–24. doi: 10.1016/S0165-5728(01)00361-7. [DOI] [PubMed] [Google Scholar]
- 4.Barclay AN. The localization of populations of lymphocytes defined by monoclonal antibodies in rat lymphoid tissues. Immunology. 1981;42:593–600. [PMC free article] [PubMed] [Google Scholar]
- 5.Buhtoiarov IN, Sondel PM, Eickhoff JC, Rakhmilevich AL. Macrophages are essential for antitumour effects against weakly immunogenic murine tumours induced by class B CpG-oligodeoxynucleotides. Immunology. 2007;120:412–423. doi: 10.1111/j.1365-2567.2006.02517.x. [DOI] [PMC free article] [PubMed] [Google Scholar]
- 6.Carpentier A, Laigle-Donadey F, Zohar S, Capelle L, Behin A, Tibi A, Martin-Duverneuil N, Sanson M, Lacomblez L, Taillibert S, Puybasset L, Van Effenterre R, Delattre JY, Carpentier AF. Phase 1 trial of a CpG oligodeoxynucleotide for patients with recurrent glioblastoma. Neuro Oncol. 2006;8:60–66. doi: 10.1215/S1522851705000475. [DOI] [PMC free article] [PubMed] [Google Scholar]
- 7.Carpentier AF, Meng Y. Recent advances in immunotherapy for human glioma. Curr Opin Oncol. 2006;18:631–636. doi: 10.1097/01.cco.0000245321.34658.f4. [DOI] [PubMed] [Google Scholar]
- 8.Carpentier AF, Xie J, Mokhtari K, Delattre JY. Successful treatment of intracranial gliomas in rat by oligodeoxynucleotides containing CpG motifs. Clin Cancer Res. 2000;6:2469–2473. [PubMed] [Google Scholar]
- 9.Damoiseaux JG, Dopp EA, Calame W, Chao D, MacPherson GG, Dijkstra CD. Rat macrophage lysosomal membrane antigen recognized by monoclonal antibody ED1. Immunology. 1994;83:140–147. [PMC free article] [PubMed] [Google Scholar]
- 10.Ehtesham M, Black KL, Yu JS. Recent progress in immunotherapy for malignant glioma: treatment strategies and results from clinical trials. Cancer Control. 2004;11:192–207. doi: 10.1177/107327480401100307. [DOI] [PubMed] [Google Scholar]
- 11.El Andaloussi A, Han Y, Lesniak MS. Prolongation of survival following depletion of CD4+CD25+ regulatory T cells in mice with experimental brain tumors. J Neurosurg. 2006;105:430–437. doi: 10.3171/jns.2006.105.3.430. [DOI] [PubMed] [Google Scholar]
- 12.El Andaloussi A, Sonabend AM, Han Y, Lesniak MS. Stimulation of TLR9 with CpG ODN enhances apoptosis of glioma and prolongs the survival of mice with experimental brain tumors. Glia. 2006;54:526–535. doi: 10.1002/glia.20401. [DOI] [PubMed] [Google Scholar]
- 13.Fecci PE, Mitchell DA, Whitesides JF, Xie W, Friedman AH, Archer GE, Herndon JE, 2nd, Bigner DD, Dranoff G, Sampson JH. Increased regulatory T-cell fraction amidst a diminished CD4 compartment explains cellular immune defects in patients with malignant glioma. Cancer Res. 2006;66:3294–3302. doi: 10.1158/0008-5472.CAN-05-3773. [DOI] [PubMed] [Google Scholar]
- 14.Fecci PE, Sweeney AE, Grossi PM, Nair SK, Learn CA, Mitchell DA, Cui X, Cummings TJ, Bigner DD, Gilboa E, Sampson JH. Systemic anti-CD25 monoclonal antibody administration safely enhances immunity in murine glioma without eliminating regulatory T cells. Clin Cancer Res. 2006;12:4294–4305. doi: 10.1158/1078-0432.CCR-06-0053. [DOI] [PubMed] [Google Scholar]
- 15.Ginzkey C, Eicker SO, Krause J, Brecht S, Hugo HH, Marget M, Mehdorn HM, Steinmann J, Hamel W (2009) DNA vaccination against rat gliomas expressing the E. coli lacZ gene as a model antigen (submitted) [DOI] [PMC free article] [PubMed]
- 16.Graeber MB, Scheithauer BW, Kreutzberg GW. Microglia in brain tumors. Glia. 2002;40:252–259. doi: 10.1002/glia.10147. [DOI] [PubMed] [Google Scholar]
- 17.Grauer OM, Molling JW, Bennink E, Toonen LW, Sutmuller RP, Nierkens S, Adema GJ. TLR ligands in the local treatment of established intracerebral murine gliomas. J Immunol. 2008;181:6720–6729. doi: 10.4049/jimmunol.181.10.6720. [DOI] [PubMed] [Google Scholar]
- 18.Hartmann G, Weeratna RD, Ballas ZK, Payette P, Blackwell S, Suparto I, Rasmussen WL, Waldschmidt M, Sajuthi D, Purcell RH, Davis HL, Krieg AM. Delineation of a CpG phosphorothioate oligodeoxynucleotide for activating primate immune responses in vitro and in vivo. J Immunol. 2000;164:1617–1624. doi: 10.4049/jimmunol.164.3.1617. [DOI] [PubMed] [Google Scholar]
- 19.Heiser A, Coleman D, Dannull J, Yancey D, Maurice MA, Lallas CD, Dahm P, Niedzwiecki D, Gilboa E, Vieweg J. Autologous dendritic cells transfected with prostate-specific antigen RNA stimulate CTL responses against metastatic prostate tumors. J Clin Invest. 2002;109:409–417. doi: 10.1172/JCI14364. [DOI] [PMC free article] [PubMed] [Google Scholar]
- 20.Ilvesaro JM, Merrell MA, Swain TM, Davidson J, Zayzafoon M, Harris KW, Selander KS. Toll like receptor-9 agonists stimulate prostate cancer invasion in vitro. Prostate. 2007;67:774–781. doi: 10.1002/pros.20562. [DOI] [PubMed] [Google Scholar]
- 21.Jander S, Schroeter M, D’Urso D, Gillen C, Witte OW, Stoll G. Focal ischaemia of the rat brain elicits an unusual inflammatory response: early appearance of CD8+ macrophages/microglia. Eur J Neurosci. 1998;10:680–688. doi: 10.1046/j.1460-9568.1998.00078.x. [DOI] [PubMed] [Google Scholar]
- 22.Jurk M, Vollmer J. Therapeutic applications of synthetic CpG oligodeoxynucleotides as TLR9 agonists for immune modulation. BioDrugs. 2007;21:387–401. doi: 10.2165/00063030-200721060-00006. [DOI] [PubMed] [Google Scholar]
- 23.Krieg AM. Development of TLR9 agonists for cancer therapy. J Clin Invest. 2007;117:1184–1194. doi: 10.1172/JCI31414. [DOI] [PMC free article] [PubMed] [Google Scholar]
- 24.Meng Y, Carpentier AF, Chen L, Boisserie G, Simon JM, Mazeron JJ, Delattre JY. Successful combination of local CpG-ODN and radiotherapy in malignant glioma. Int J Cancer. 2005;116:992–997. doi: 10.1002/ijc.21131. [DOI] [PubMed] [Google Scholar]
- 25.Merrell MA, Ilvesaro JM, Lehtonen N, Sorsa T, Gehrs B, Rosenthal E, Chen D, Shackley B, Harris KW, Selander KS. Toll-like receptor 9 agonists promote cellular invasion by increasing matrix metalloproteinase activity. Mol Cancer Res. 2006;4:437–447. doi: 10.1158/1541-7786.MCR-06-0007. [DOI] [PubMed] [Google Scholar]
- 26.Perry VH, Gordon S. Modulation of CD4 antigen on macrophages and microglia in rat brain. J Exp Med. 1987;166:1138–1143. doi: 10.1084/jem.166.4.1138. [DOI] [PMC free article] [PubMed] [Google Scholar]
- 27.Roman M, Martin-Orozco E, Goodman JS, Nguyen MD, Sato Y, Ronaghy A, Kornbluth RS, Richman DD, Carson DA, Raz E. Immunostimulatory DNA sequences function as T helper-1-promoting adjuvants. Nat Med. 1997;3:849–854. doi: 10.1038/nm0897-849. [DOI] [PubMed] [Google Scholar]
- 28.Schabowsky RH, Madireddi S, Sharma R, Yolcu ES, Shirwan H. Targeting CD4+CD25+FoxP3+ regulatory T-cells for the augmentation of cancer immunotherapy. Curr Opin Investig Drugs. 2007;8:1002–1008. [PubMed] [Google Scholar]
- 29.Schartner JM, Hagar AR, Van Handel M, Zhang L, Nadkarni N, Badie B. Impaired capacity for upregulation of MHC class II in tumor-associated microglia. Glia. 2005;51:279–285. doi: 10.1002/glia.20201. [DOI] [PubMed] [Google Scholar]
- 30.Schluesener HJ, Seid K, Deininger M, Schwab J. Transient in vivo activation of rat brain macrophages/microglial cells and astrocytes by immunostimulatory multiple CpG oligonucleotides. J Neuroimmunol. 2001;113:89–94. doi: 10.1016/S0165-5728(00)00428-8. [DOI] [PubMed] [Google Scholar]
- 31.Steinmann J, Kaden J, May G, Schroder K, Herwartz C, Muller-Ruchholtz W. Failure of in vitro T-cell assays to predict clinical outcome after human kidney transplantation. J Clin Lab Anal. 1994;8:157–162. doi: 10.1002/jcla.1860080308. [DOI] [PubMed] [Google Scholar]
- 32.Watters JJ, Schartner JM, Badie B. Microglia function in brain tumors. J Neurosci Res. 2005;81:447–455. doi: 10.1002/jnr.20485. [DOI] [PubMed] [Google Scholar]
- 33.Zeis M, Siegel S, Wagner A, Schmitz M, Marget M, Kuhl-Burmeister R, Adamzik I, Kabelitz D, Dreger P, Schmitz N, Heiser A. Generation of cytotoxic responses in mice and human individuals against hematological malignancies using survivin-RNA-transfected dendritic cells. J Immunol. 2003;170:5391–5397. doi: 10.4049/jimmunol.170.11.5391. [DOI] [PubMed] [Google Scholar]