


Fig. 2.
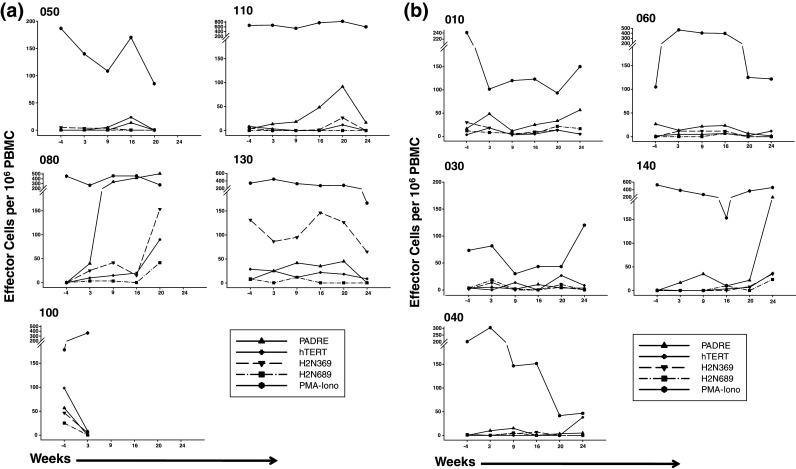

ELISPOT analysis was performed using PBMCs obtained at the indicated time points post-vaccination against hTERT 988Y, her2/neu 369V2V9, 689, and PADRE for patients on Arm 1 (a), and Arm 2 or a single low dose of cyclophosphamide prior to IDD-6 (b). Responses to PMA and ionomycin from 5 × 10³ cells are also shown; note scale difference. Longitudinal analysis was performed at baseline (−4 weeks) and post-vaccination. Composite plots for each peptide are also depicted with median values denoted by times symbol at each time point (c)