


Figure 7: PERK does not regulate astrocyte number or morphology.
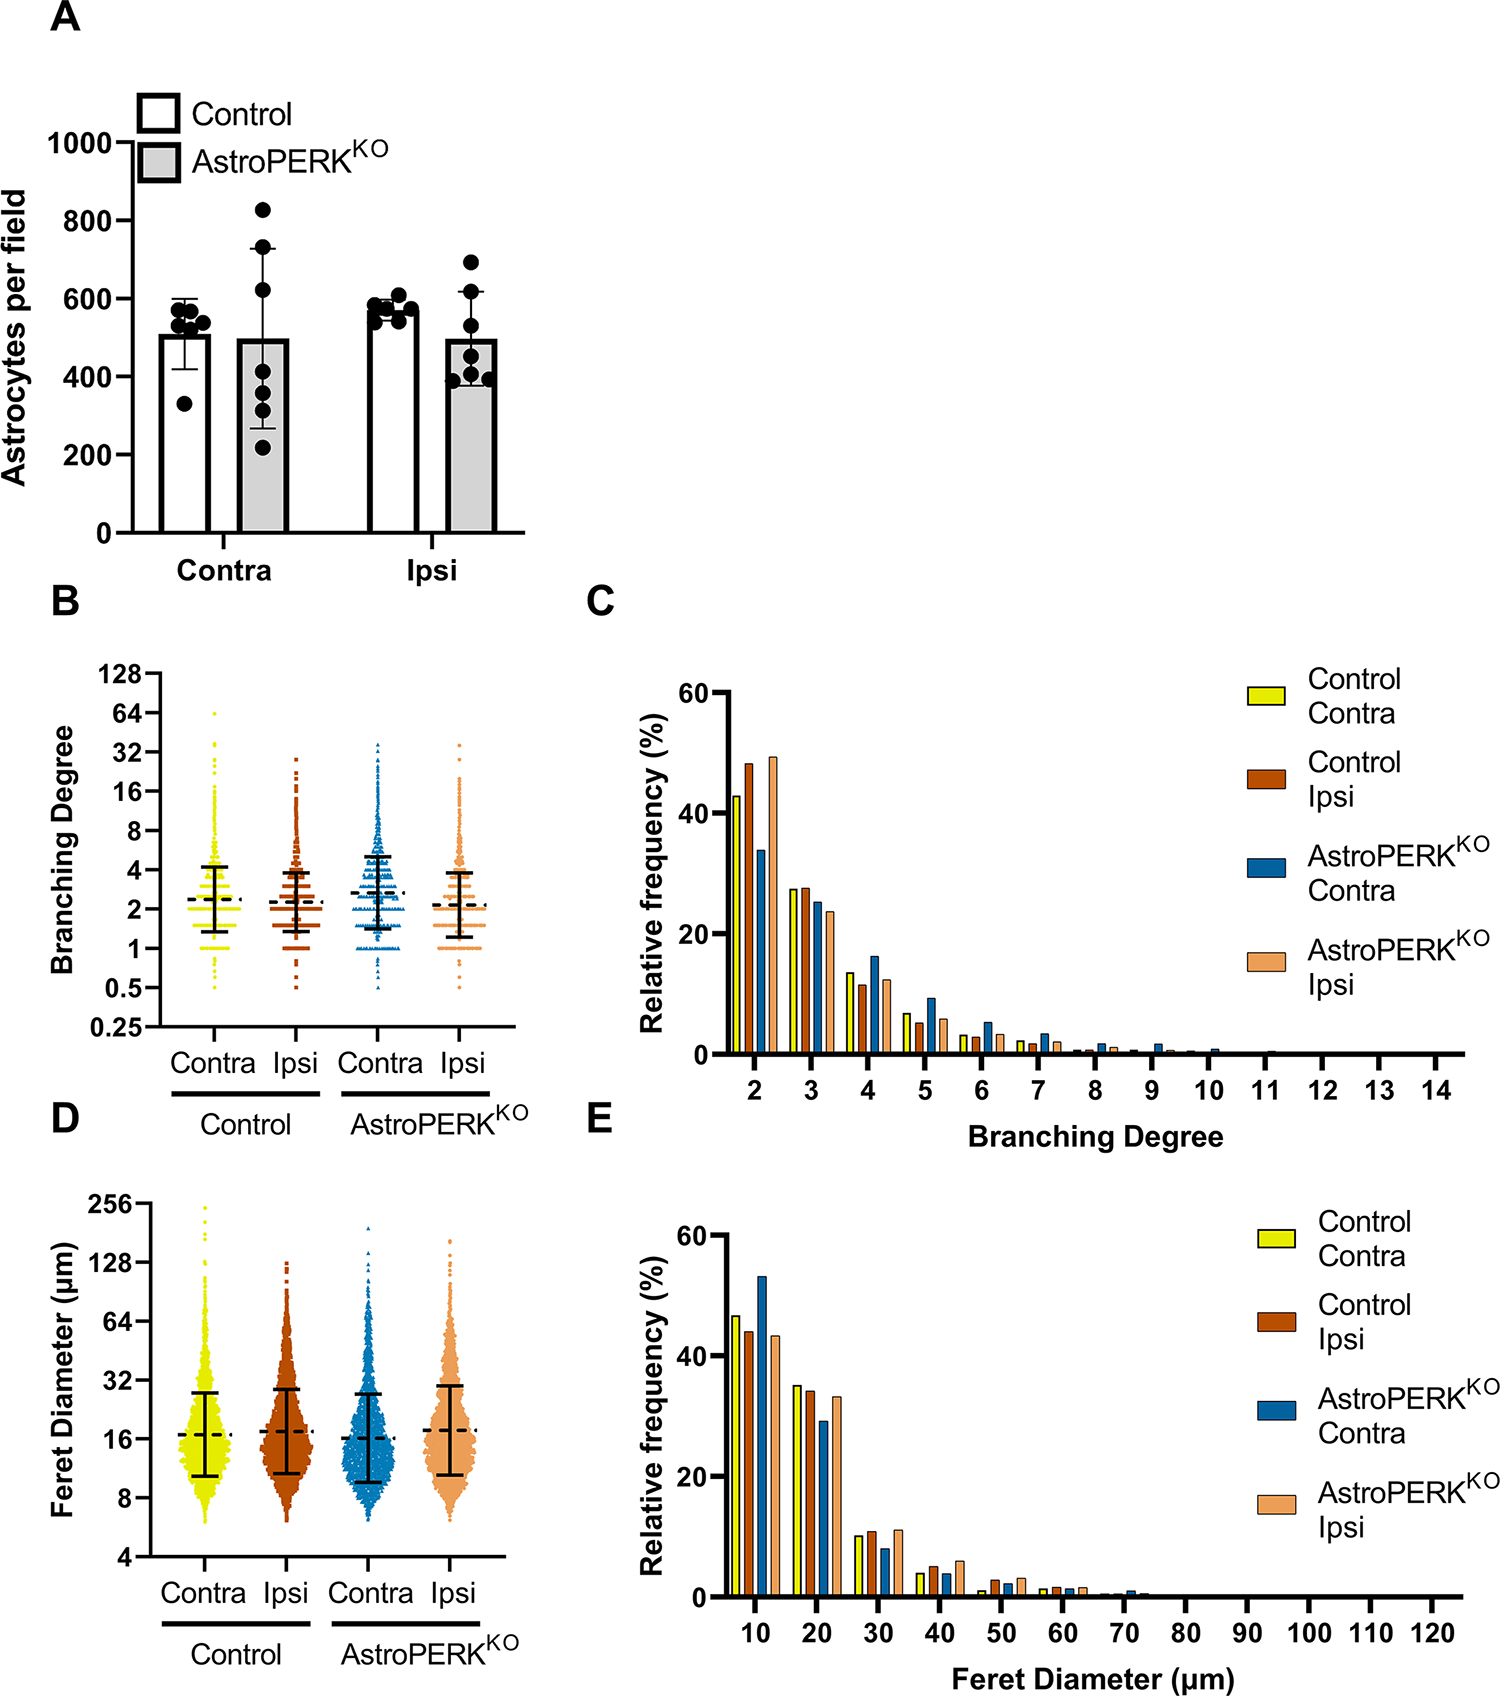
Tissue from a subset of animals shown in figure 5 were used for immunostaining. (A) GFAP+ astrocytes were quantified from 2 – 3 fields per animal from 3 mice of each genotype. Each point represents a microscopy field. (B) Branching degree (number of terminal branches / branches originating from the soma) was quantified and each data point represents an individual astrocyte. Dashed line and error bars represent geometric mean and SD. (C) Relative distribution of cells based on branching degree (graph is truncated when frequency reached < 0.2%). (D) Feret diameter was quantified, and each data point represents an individual astrocyte. Dashed line and error bars represent geometric mean and SD. (E) Relative distribution of cells based on Feret diameter (graph is truncated when frequency reached < 0.2%).